
Technical Memorandum
DATE: August 20, 2015
TO: Joseph Frawley, MassDOT Highway Division, District 3 Bryan Taberner, Director of Planning and Development, Franklin Michael Maglio, Town Engineer, Franklin
FROM: Seth Asante and Andrew Nagle, MPO Staff
RE: Route 140 Arterial Segment Study in Franklin
This memorandum summarizes the analyses and improvement alternatives resulting from the Route 140 Arterial Segment Study in Franklin. The opening sections provide background information for the study by describing the existing conditions and problems within the community. An assessment of the safety and operational problems, and a discussion of the potential improvement strategies, follows the background sections. The memo’s final section presents study recommendations. The memorandum also includes technical appendices, which cite the methods used, and data applied, in the study, including detailed reports about the intersection capacity analyses. If implemented, the report’s recommendations would result in an improved roadway corridor: one where it is safe to walk or bicycle to shops and schools; one that provides safer access to businesses; and one where traffic operates efficiently.
The Boston Region MPO’s Long-Range Transportation Plan (LRTP), Paths to a Sustainable Region, identified needs for all modes of transportation in the MPO region.1 These needs guide decision making about which projects to include in future Transportation Improvement Plans (TIPs).2 Examples of projects that address the region’s current mobility needs are maintaining and modernizing roadways with high levels of congestion and safety problems; expanding the quantity and quality of walking and bicycling; increasing adherence to transit service schedules, and making transit service more efficient and modern. Based on previous and ongoing transportation planning work, including the Boston Region MPO’s congestion management process (CMP), the Massachusetts Bay Transportation Authority’s (MBTA) Program for Mass Transportation (PMT), and other MPO planning studies, the LRTP identified 44 arterial segments in 45 communities where highways need improvements.
To identify strategies and solutions for addressing problems in some of these arterial segments, a study was included in the federal fiscal year (FFY) 2014 Unified Planning Work Programs (UPWP). An arterial segment study is a logical way to identify and address multimodal transportation needs in a corridor. An arterial segment study typically uses a holistic approach that analyzes services and makes associated recommendations within the roadway’s right-of-way, and takes into account the needs of all abutters and users—pedestrians, bicyclists, motorists, and public-transportation riders.
During the past four years, the MPO has conducted these planning studies, and municipalities in the region have been receptive to them. The studies provide cities and towns with the opportunity to review the requirements of a specific arterial segment, starting at the conceptual level, before committing design and engineering funds. If the project qualifies for federal funds, the study’s documentation also may be useful to the Massachusetts Department of Transportation (MassDOT).
Following a selection process based on safety conditions3, congested conditions4, multimodal significance5, regional significance6, and implementation potential7, the Route 140 arterial segment in Franklin was approved for study by the Boston Region MPO from a short list of 44 arterial segments. MassDOT Highway Division District 3, the 495/MetroWest Partnership, and the town of Franklin supported the study and were willing to review potential improvements for implementation.
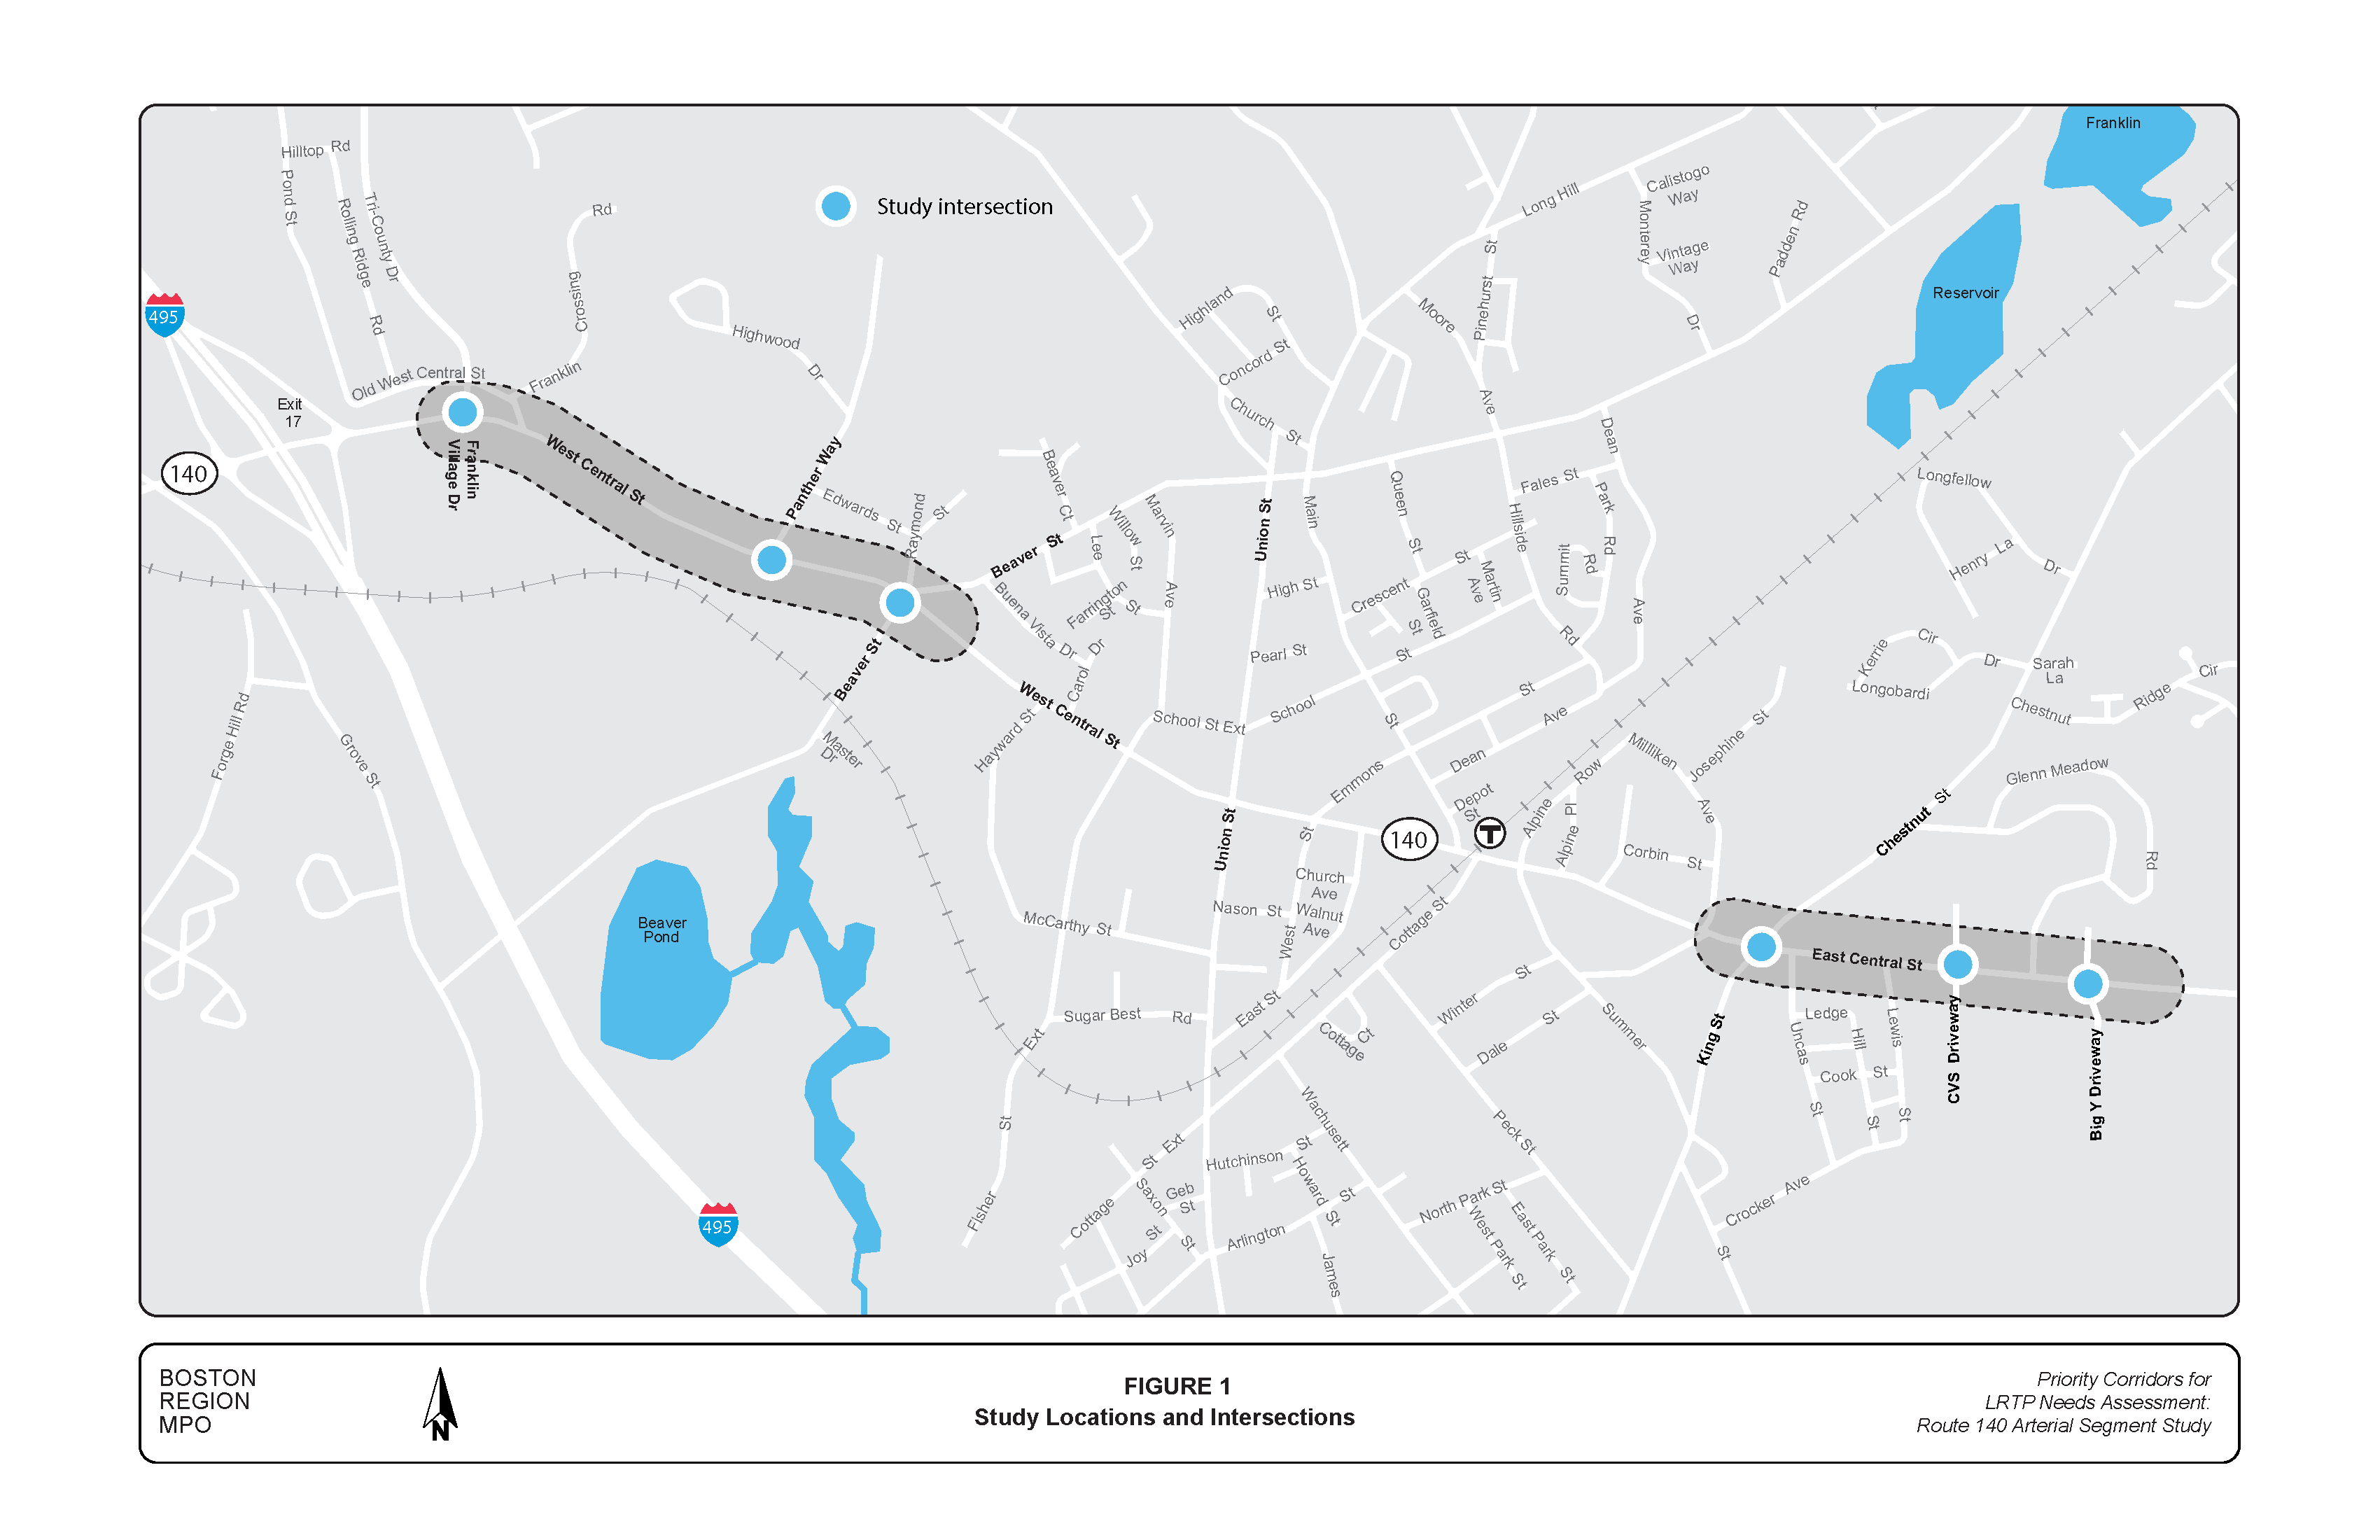
Route 140 in Franklin is a north-south arterial, but generally runs in an east-west direction. Therefore, the eastbound direction in Franklin is designated Route 140 South and the westbound direction is designated Route 140 North. The local names are West Central Street and East Central Street. Route 140 in Franklin (excluding the segment in the town center from Emmons Street to Summer Street)—programmed in the FFY 2013 TIP—was the segment chosen for study. Figure 1 shows the two specific segments of focus, which are as follows:
The purposes of this study were to inventory existing problems and develop multimodal improvements, which address the following:
An advisory task force, composed of representatives from MassDOT Highway Division 3 and the town of Franklin, was established to participate in this study. MPO staff met with the task force twice: first to discuss the work scope and finalize the existing conditions and problems, and second to present improvements and obtain comments. Based on the problems in each arterial segment, the task force suggested the study should focus on:
This memorandum reflects feedback from the task force. Appendix A includes a list of task force members and their comments.
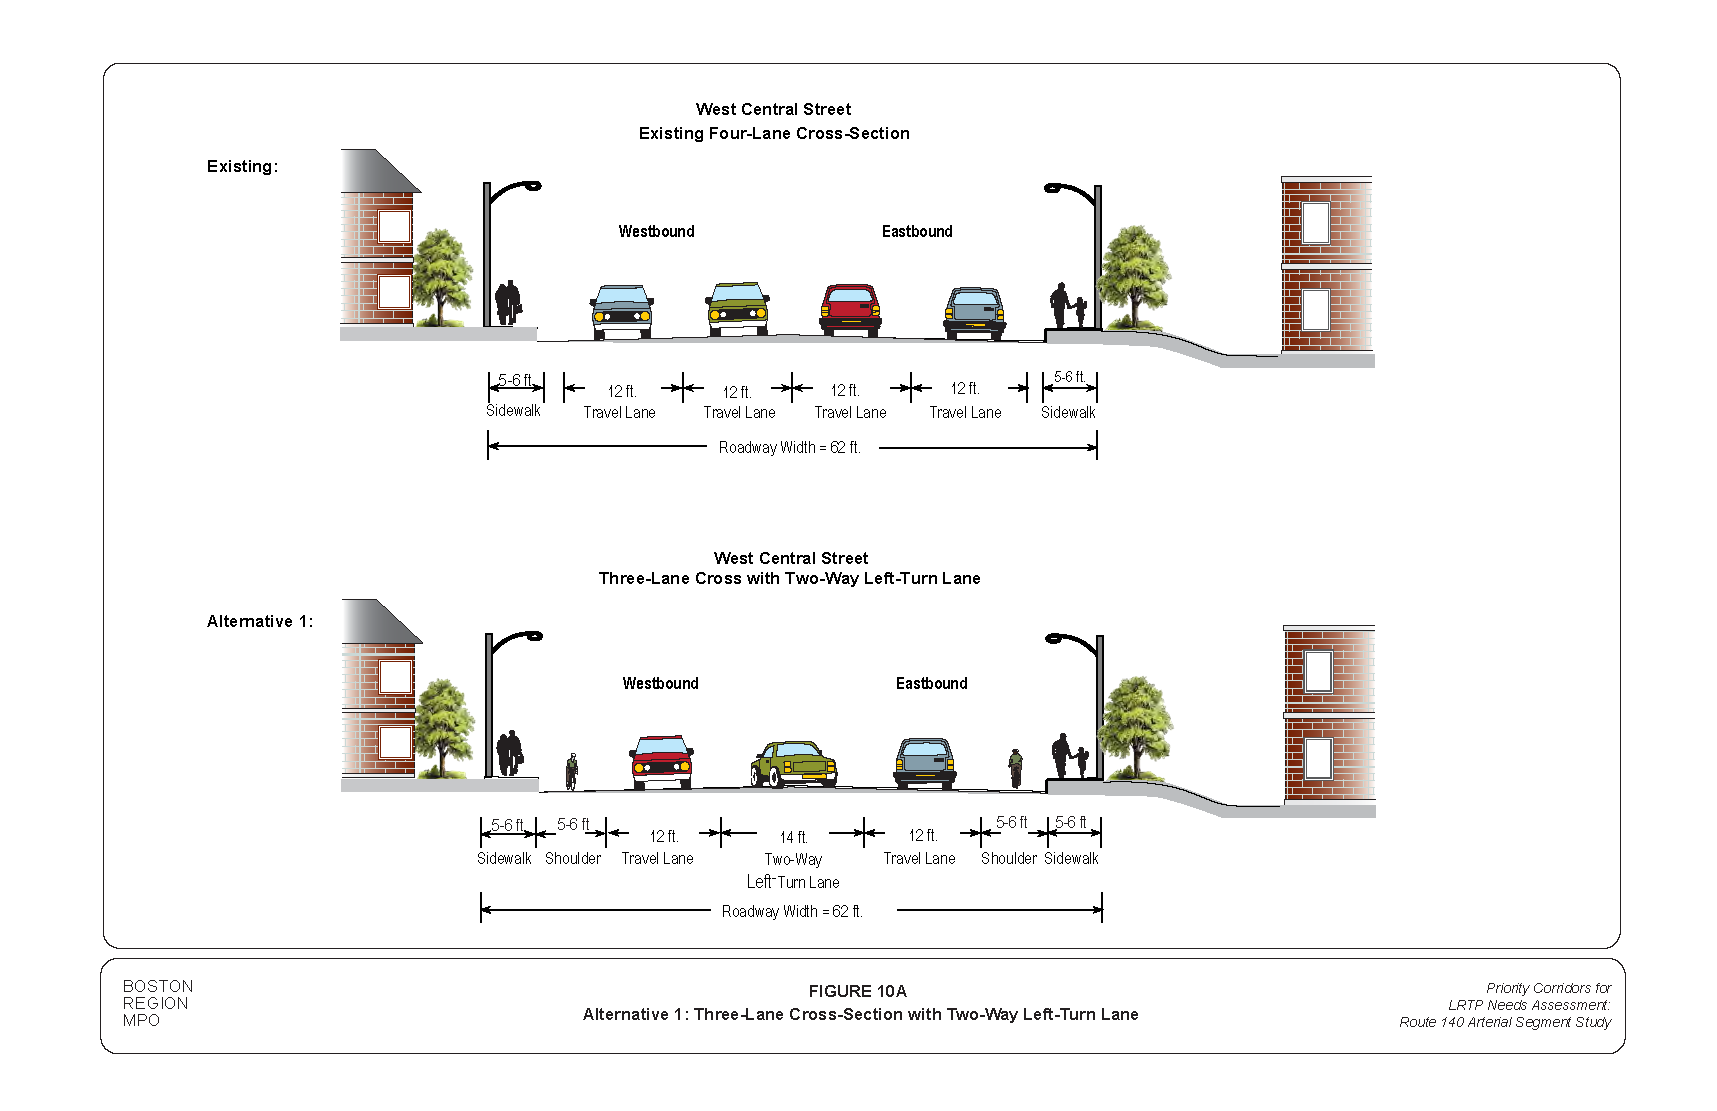
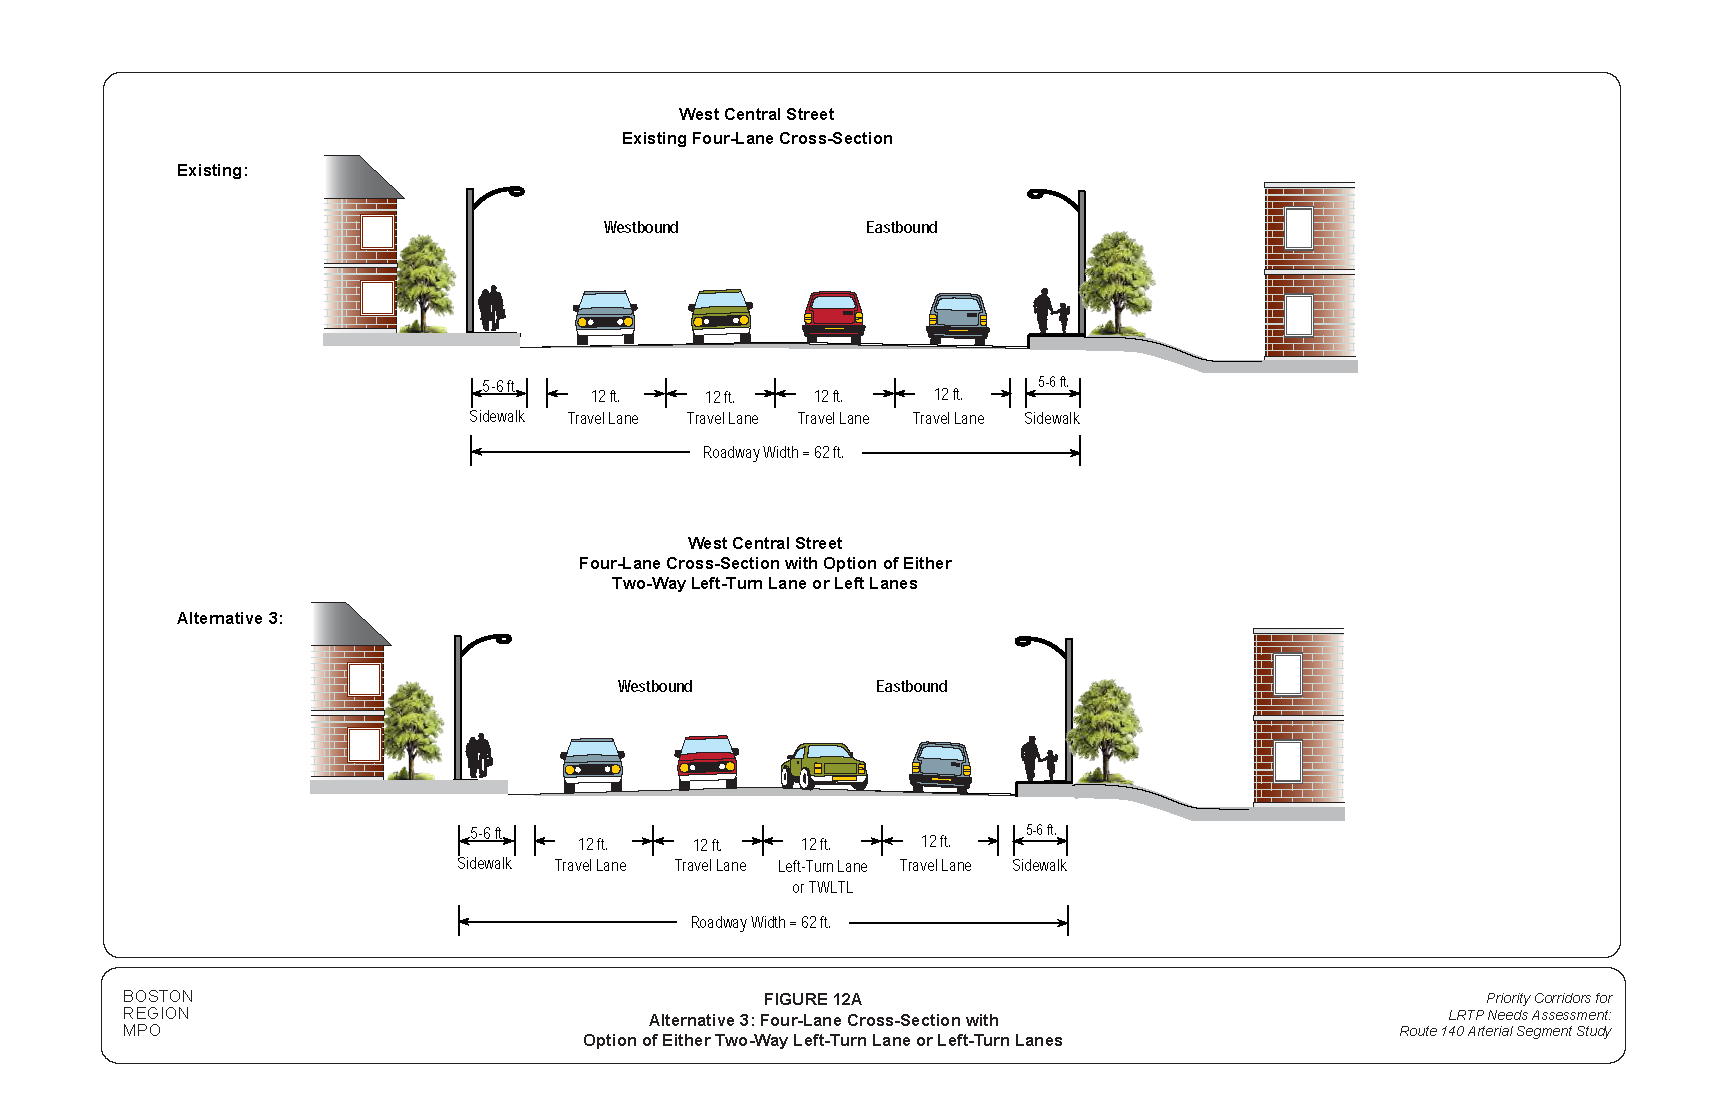
The West Central Street segment is approximately 0.7 miles long, and is under MassDOT jurisdiction. This segment is an urban principal arterial on the National Highway System (NHS) Program, making it eligible for federal funds. West Central Street is a four-lane undivided roadway carrying about 21,000 vehicles per day. There are three signalized intersections in the study segment, and the driveway density is approximately 48 driveways per mile (both sides of roadway). The right-of-way is about 62 feet wide—consisting of four 12-foot-wide travel lanes, six-foot sidewalks, and one-foot shoulders on both sides. However, there is no useable shoulder in the segment. The posted speed limit is 40 mph in both directions and the land use adjacent to the roadway is zoned commercial. In addition, West Central Street connects I-495 and several communities to the west of Franklin, such as Bellingham and Milford.
The East Central Street segment is about 0.5 miles long and is owned by both MassDOT and the town of Franklin. It is an urban principal arterial and on the National Highway System (NHS) Program, making it eligible for federal funds. The right-of-way is approximately 55 feet wide—consisting of two 11-foot travel lanes, three-to-six-foot-wide shoulders, and five-foot sidewalks on both sides of the roadway. There are three signalized intersections in the segment and the driveway density is approximately 60 driveways per mile (both sides of roadway). The posted speed limit is 40 mph in both directions and the land use adjacent to the roadway is zoned commercial. In addition, East Central Street connects several communities to the east of Franklin including Wrentham and Foxborough.
Franklin Village Drive and Old West Central Street intersect at West Central Street to form a four-leg intersection as shown in the aerial photo below. Each approach of West Central Street has an exclusive left-turn lane, two through lanes, and an exclusive right-turn lane. Franklin Village Drive and Old West Central Street have an exclusive left-turn lane, a through lane, and an exclusive right-turn lane on each approach. The intersection has a fully actuated traffic signal with functioning accessible pedestrian signals. The accessible pedestrian signals are devices with non-visual formats that communicate the WALK and DON’T WALK intervals at signalized intersections to pedestrians who are blind or who have low vision. The traffic signal is equipped with the Opticom system, which handles emergency vehicle preemption. The signal heads have backplates, which improve visibility and are span-wire mounts. There are crosswalks with curb ramps across Old West Central Street and the east leg of West Central Street. The curb ramps lack detectable-warning-plates and do not fully comply with the Americans with Disabilities Act (ADA) standards. The intersection curb radii are adequate for trucks and buses servicing commercial and retail businesses and schools in the area. The busy Franklin Village Shopping Center is located on the south side of the intersection while Tri-County Regional Vocational Technical High School and a large residential area are located north of the intersection.

West Central Street at Franklin Village Drive
Source: Google Earth

West Central Street at Panther Way
Source: Google Earth
Beaver Street intersects West Central Street to form a four-leg intersection as shown in the aerial photo at the right. West Central Street has three travel lanes on the eastbound approach (exclusive left-turn lane, through lane, and shared through/right-turn lane) and two travel lanes on the westbound approach (exclusive left-turn lane and shared through/right-turn lane). Beaver Street has two travel lanes on the southbound approach (exclusive right-turn lane and shared through/left lane) and one travel lane for all movements on the northbound approach. The intersection has a fully actuated traffic signal, but is not equipped with the Opticom system, which handles emergency vehicle preemption. The traffic signal heads are span-wire mounts, but do not have backplates. The intersection is equipped with functioning audible pedestrian signals, but they are not fully accessible. There is a crosswalk with curb ramps on all four legs of the intersection, but they lack detectable warning plates. The intersection curb radii are adequate for trucks and school buses servicing commercial and retail businesses and schools in the area. The land uses in the vicinity include commercial, agricultural, and residential.

West Central Street at Beaver Street
Source: Google Earth
King Street and Chestnut Street intersect East Central Street to form a four-leg intersection as shown in the aerial photo below. Each East Central Street approach has two travel lanes (exclusive left-turn lane and shared through/right-turn lane). Chestnut Street has one travel lane for all southbound traffic movements. King Street has two travel lanes (exclusive right-turn lane and shared through/left-turn lane).
The intersection has a fully actuated traffic signal with functioning pedestrian signals, but they are not accessible. It is equipped with an Opticom system, which handles emergency vehicle preemption. The traffic signal heads are mast-arm mounts, but the majority of them do not have backplates. There are crosswalks with curb ramps on all four legs of the intersection, but the curb ramps lack detectable warning plates. The intersection curb radii on King Street and Chestnut Street are not adequate for trucks to turn left onto East Central Street because both streets intersect East Central Street at an oblique angle. Truck drivers familiar with the intersection use Summer Street (located south of the intersection) to avoid this difficult maneuver. Walgreen Pharmacy, Franklin Ford, and Shaw’s Supermarket are located at the intersection. In addition, Horace Mann Plaza and Big Y Store are located on East Central Street close to the intersection.

East Central Street at King Street/Chestnut Street
Source: Google Earth
The driveways to the CVS Pharmacy and the Horace Mann Plaza intersect East Central Street to form a four-leg intersection as shown in the aerial photo at right. Each East Central Street approach has three travel lanes (exclusive left-turn lane, through lane, and exclusive right-turn lane). There are two travel lanes (exclusive right-turn lane and shared through/left-turn lane) for traffic exiting from either Horace Mann Plaza or the CVS Pharmacy. The intersection has a fully actuated traffic signal with functioning pedestrian signals and pushbuttons, but they are not accessible. There is no emergency preemption at the intersection. The signal heads are mast-arm mounts and have backplates. There are supplementary signal heads with backplates on post mounts, which have been installed for the exclusive turn movements. There are crosswalks with curb ramps on three legs of the intersection except for the west leg of East Central Street. The curb ramps lack detectable warning plates. The intersection curb radii are adequate for trucks and buses servicing commercial businesses in the area. The land uses in the area are commercial, retail, and professional services.

East Central Street at Horace Mann Plaza Entrance
Source: Google Earth
The driveways to the Big Y Store and the Franklin Municipal Center intersect East Central Street to form a four-leg intersection as shown in the aerial photo at the right. Each approach of East Central Street has two travel lanes (exclusive left-turn lane and shared through/right-turn lane). There are two travel lanes for traffic exiting from the Big Y Store (exclusive right-turn lane and shared through/left-turn lane). There is one travel lane for all traffic movements exiting from the municipal center. The intersection has a fully actuated traffic signal with functioning pedestrian signals, but they are not accessible. It is equipped with an Opticom system, which handles emergency vehicle preemption. The signal heads are mast-arm mounts and have backplates. There are supplementary signal heads with backplates on post mounts, which have been installed for the exclusive turn movements. There are crosswalks with curb ramps, but the curb ramps lack detectable warning plates on three legs of the intersection except for the east leg of East Central Street. The intersection curb radii are adequate for trucks and buses. The land uses in the area are commercial, retail, and professional services.

East Central Street at Big Y Store Driveway
Source: Google Earth
The MassDOT Highway Division’s Traffic Data Collection performed turning-movement counts (TMCs) at the signalized intersections in April 2014, when schools were in session. The counts were conducted during weekday morning (7:00 AM to 9:00 AM), midday (11:00 AM to 1:00 PM), and evening (4:00 PM to 6:00 PM) peak travel periods and during Saturday midday (11:00 AM to 2:00 PM) travel period. Heavy vehicles such as school buses, transit buses, and trucks were counted separately. Pedestrian and bicycle counts were conducted simultaneously with the TMCs. In addition, MassDOT Highway Division’s Traffic Data Collection conducted automatic traffic recorder (ATR) counts at nine locations on West Central Street, East Central Street, Beaver Street, Chestnut Street, and King Street. The ATR counts are continuous 48-hour traffic counts used to determine average daily traffic (ADT) of a roadway. In addition, MPO staff performed driveway counts at selected locations on West Central Street.
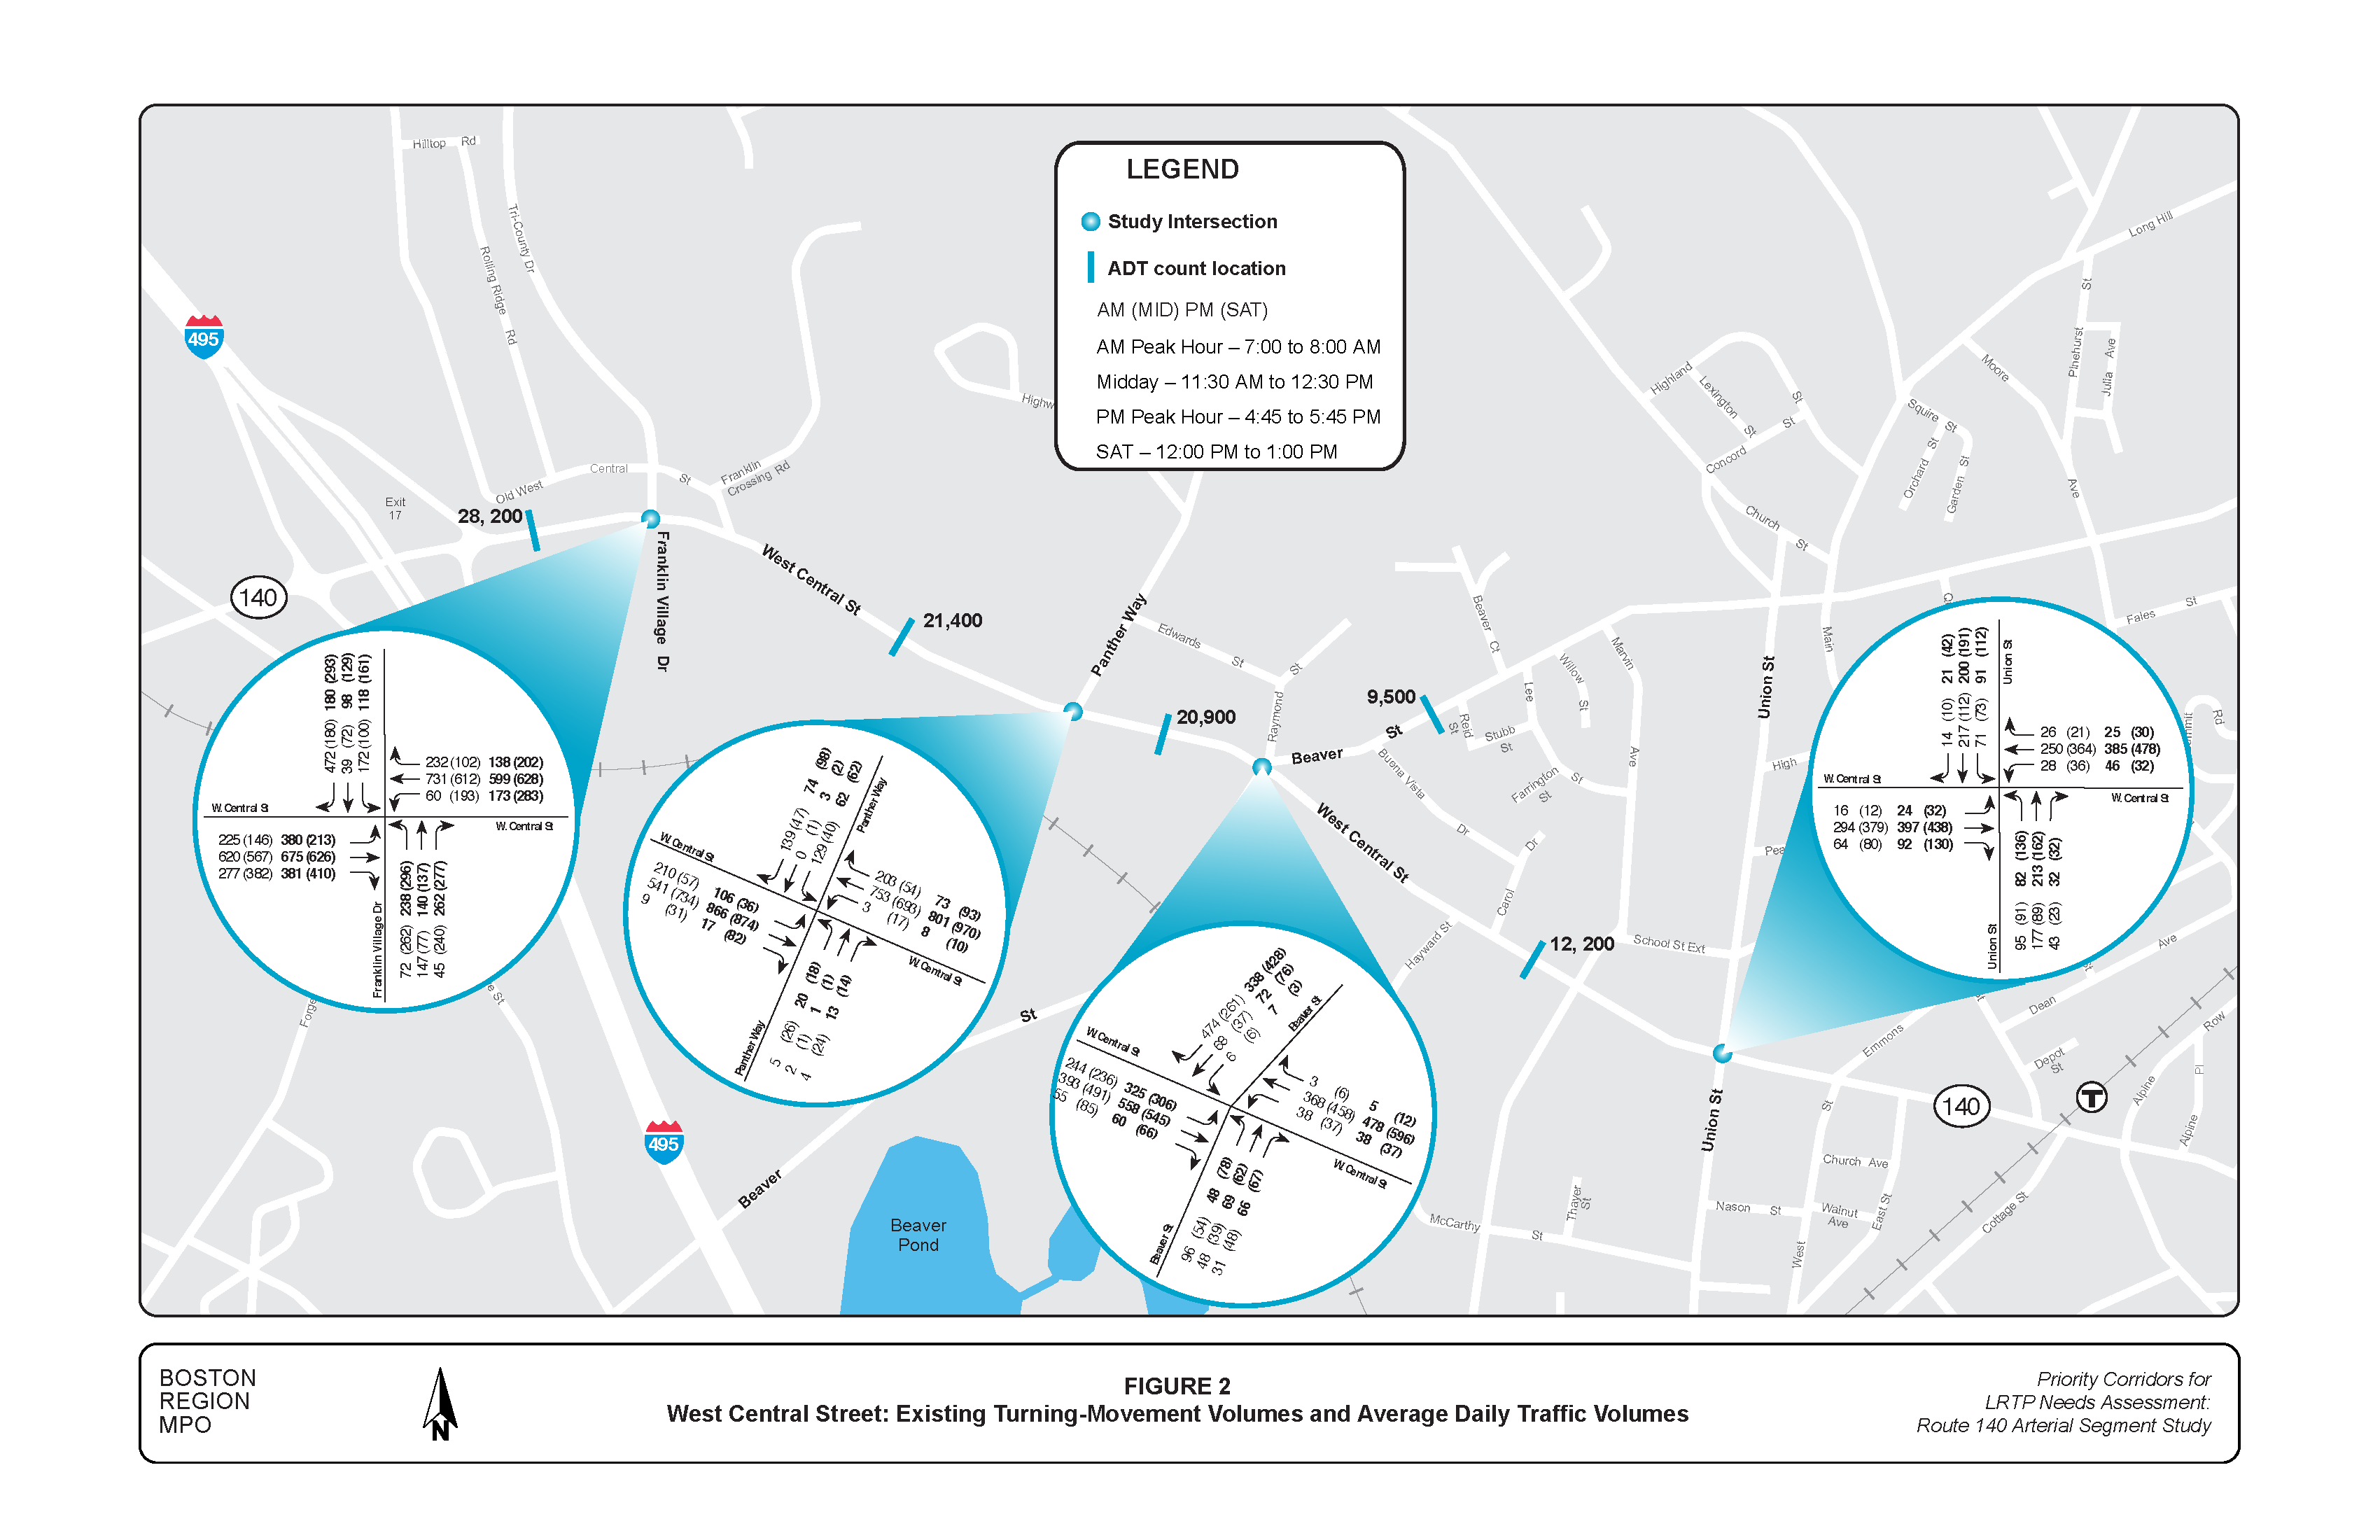
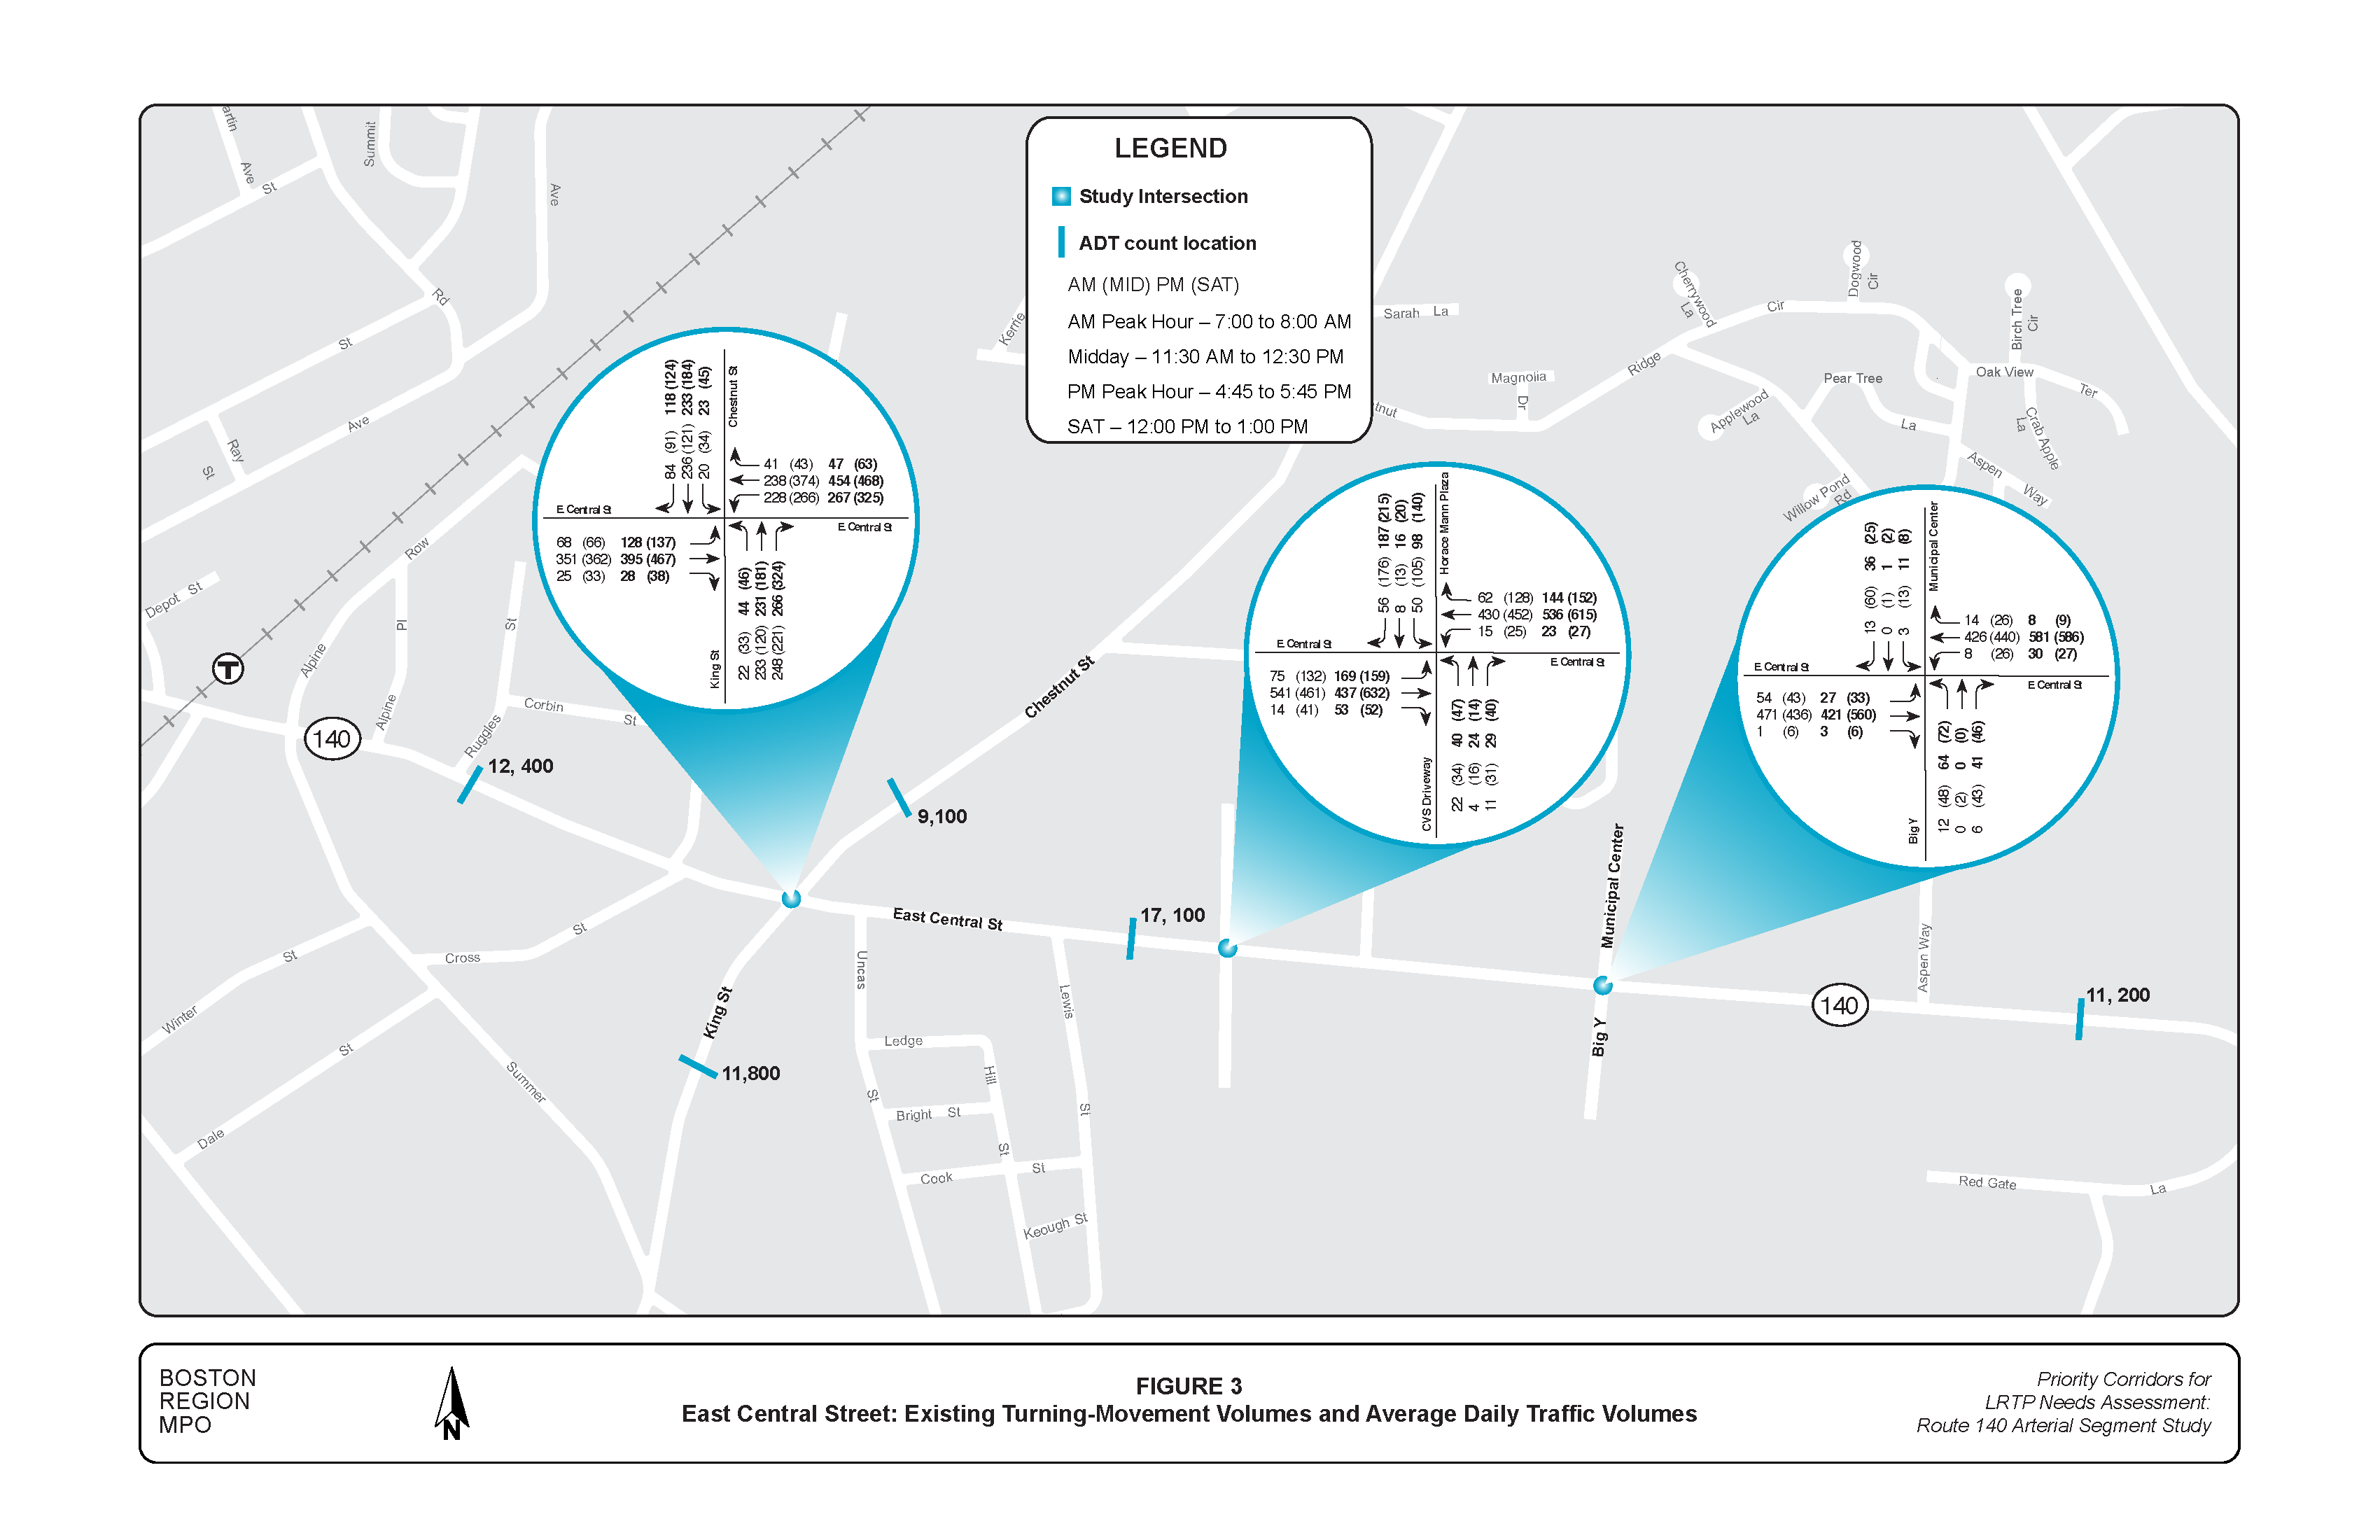
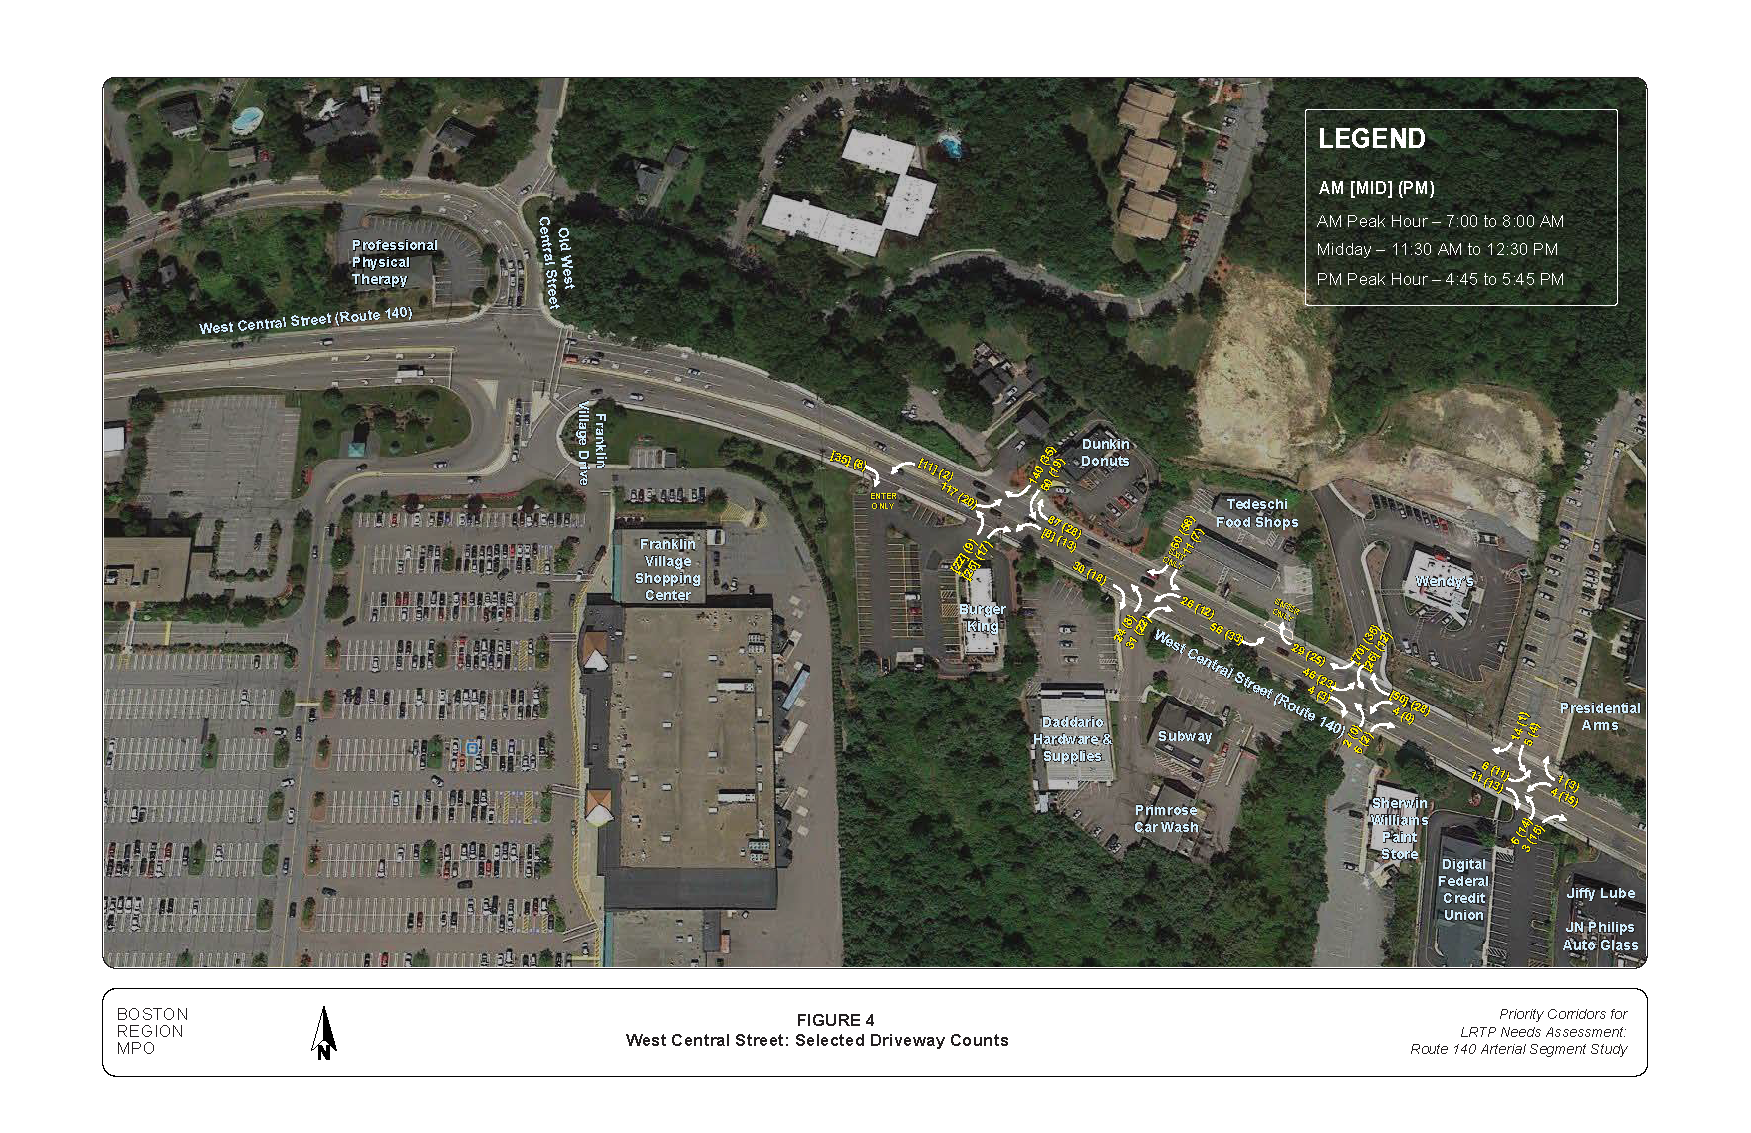
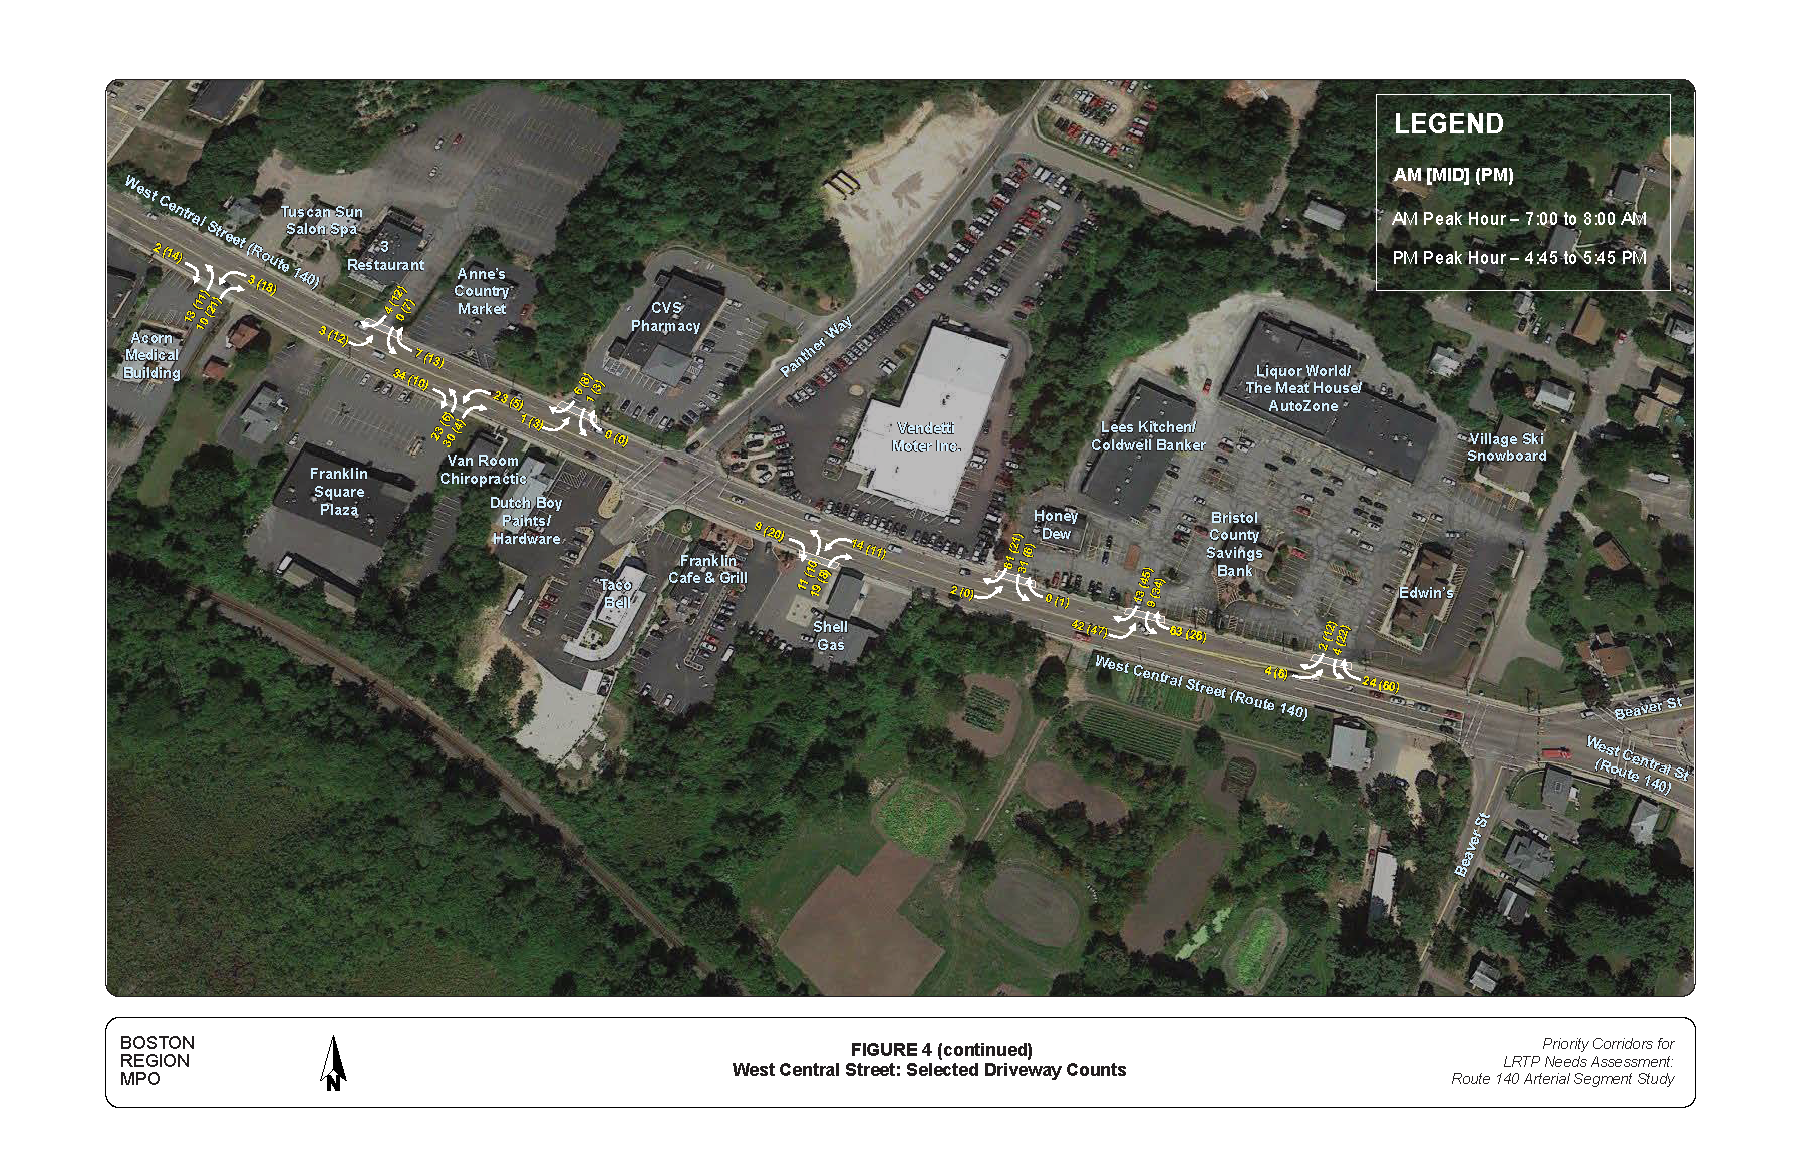
Figures 2 and 3 show the peak-hour turning movement volumes for the signalized intersections along with the ADT for West Central Street and East Central Street, respectively. The selected driveway counts on West Central Street are shown in Figure 4. The TMC, ADT, and driveway counts are in Appendix B. Table 1 presents the number of pedestrians and bicyclists observed at the intersections. These volumes may be low because of the colder weather in April, high traffic volume during peak periods, and lack of amenities that provide safety and comfort for bicyclists, such as shoulders or bicycle lanes. Table 2 shows the percentage of trucks in the study-area intersections, which range between 1.7 and 4.2 percent. These truck rates are not considered particularly high for peak-period traffic conditions. Staff also identified that turning radii at the King Street/Chestnut Street intersection inhibit truck traffic flow.
TABLE 1
Pedestrian and Bicycle Volumes
Arterial Segment/ Intersection |
Weekday Pedestrians |
Saturday Pedestrians |
Weekday Bicyclists |
Saturday Bicyclists |
|---|---|---|---|---|
West Central Street at |
||||
Franklin Village Drive |
0 |
3 |
2 |
4 |
Panther Way |
17 |
52 |
0 |
5 |
Beaver Street |
19 |
38 |
1 |
3 |
East Central Street |
||||
King Street/Chestnut Street |
28 |
36 |
1 |
3 |
Horace Mann Plaza |
17 |
33 |
3 |
3 |
Big Y Store Driveway |
30 |
32 |
1 |
5 |
Source: Central Transportation Planning Staff.
TABLE 2
Percentage of Heavy Vehicles at the Signalized Intersections
Intersection/Approach |
Percentage of Heavy Vehicles |
|---|---|
West Central Street at Franklin Village Drive |
-- |
West Central Street Eastbound |
3.7% |
West Central Street Westbound |
3.3 |
Franklin Village Drive |
2.7 |
Old West Central Street |
2.8 |
West Central Street at Panther Way |
-- |
West Central Street Eastbound |
3.6% |
West Central Street Westbound |
3.6 |
Panther Way Northbound |
4.2 |
Panther Way Southbound |
2.7 |
West Central Street at Beaver Street |
-- |
West Central Street Eastbound |
3.7% |
West Central Street Westbound |
3.4 |
Beaver Street Northbound |
4.5 |
Beaver Street Southbound |
3.1 |
East Central Street at King Street/Chestnut Street |
-- |
East Central Street Eastbound |
2.9% |
East Central Street Westbound |
3 |
King Street Northbound |
3.9 |
Chestnut Street Southbound |
4.1 |
East Central Street at Horace Mann Plaza |
-- |
East Central Street Eastbound |
3.2% |
East Central Street Westbound |
3.2 |
CVS Northbound |
0.6 |
Horace Mann Plaza Southbound |
1.7 |
East Central Street at Big Y Driveway |
-- |
East Central Street Eastbound |
3.8% |
East Central Street Westbound |
3.3 |
Big Y Driveway Northbound |
1.9 |
Municipal Center Southbound |
4 |
Source: Central Transportation Planning Staff.
The Greater Attleboro Regional Transit Authority (GATRA) operates the Franklin Area Bus (FAB) within the study area. During weekdays, the bus service connects Franklin Village Mall to the Big Y store—the termini of the bus route. The bus service operates along a circuit route; with one traveling clockwise around the circuit and the other operating counter clockwise. On Saturdays, the bus route is extended to Whole Foods/Old Navy and Market Basket on Route 126 in Bellingham. The bus service connects major shopping centers, apartments, and schools, and the route includes East Central Street with stops at the Horace Mann Plaza and the Big Y Store. Bus service also connects the Franklin Village Shopping Center via Pond Street and Old West Central Street. The FAB operates Monday through Friday every 60 minutes from 6:40 AM to 5:36 PM and Saturday every 60 minutes from 8:20 AM to 5:45 PM. In addition to the designated stops, passengers may board FAB anywhere along the bus route as long as it is safe for the bus to stop. To signal the bus driver, the passenger waves to the driver as the vehicle approaches. All GATRA vehicles are equipped with accessibility for wheelchairs.8
Many commuter rail riders who board the MBTA’s Franklin Line from the Forge Park Station and Franklin/Dean College Station use portions of West Central Street and East Central Street to access the station.
MPO staff used January 2009 through December 2012 crash data from the MassDOT’s Registry of Motor Vehicles database to evaluate safety for motorists, pedestrians, and bicyclists. The following section describes the analysis and results of the safety assessment.
A crash summary that identifies severity, manner of collision, ambient light, road surface, and weather conditions is presented in Table 3. This summary is based on 2009-12 crash reports from the MassDOT Registry of Motor Vehicles crash database. The most recent 2012 statewide average crash rate for an urban principal arterial is 3.35 crashes per million vehicles-miles traveled.9 Both arterial segments analyzed had high crash rates, which exceeded the statewide average crash rate for an urban principal arterial. See Appendix C for the crash rate worksheets.
In addition, the analysis indicates that the West Central Street and East Central Street crashes display similar statistics:
TABLE 3
2009–12 Crash Summary
West Central Street and East Central Street Segments
Crash Variable |
West Central Street |
East Central Street |
|---|---|---|
Crash Severity |
-- |
-- |
Fatal injury |
0 |
1 |
Non-fatal injury |
32 |
25 |
Property damage only |
95 |
58 |
Unknown /not reported |
5 |
2 |
Manner of Collision |
-- |
-- |
Angle |
47 |
31 |
Rear-end |
60 |
33 |
Sideswipe, opposite direction |
0 |
2 |
Sideswipe, same direction |
11 |
6 |
Single vehicle crash |
10 |
9 |
Head-on |
1 |
1 |
Unknown /not reported |
3 |
4 |
Road Surface Condition |
-- |
-- |
Dry |
90 |
57 |
Wet |
22 |
13 |
Sand, mud, dirt, oil, gravel |
1 |
0 |
Snow |
1 |
2 |
Not reported |
18 |
14 |
Ambient Light Condition |
-- |
-- |
Daylight |
108 |
66 |
Dark - lighted roadway |
18 |
14 |
Dark - roadway not lighted |
1 |
2 |
Dark - unknown roadway lighting |
0 |
1 |
Dusk |
2 |
2 |
Not reported/unknown |
3 |
1 |
Weather Condition |
-- |
-- |
Clear |
88 |
59 |
Cloudy |
16 |
10 |
Rain |
20 |
10 |
Snow/ice/freezing rail |
4 |
3 |
Not Reported/unknown |
4 |
4 |
Bicycle and pedestrian involved |
-- |
-- |
Bicyclist |
1 |
1 |
Pedestrian |
1 |
3 |
Total crashes |
132 |
86 |
Four-year average |
33 |
22 |
Segment crash rate |
6.04 |
5.74 |
Principal arterial (other)—average statewide crash rate |
3.35 |
3.35 |
Notes: * The AM peak period is 7:00 AM to 9:00 AM, and the PM peak period is 4:00 PM to 6:00 PM.
Source: Central Transportation Planning Staff.
Table 4 presents a crash summary at the intersections that identifies severity, manner of collision, road surface, weather, and ambient light conditions. The summary excludes crashes at the intersection of East Central Street and the Big Y store/Franklin Municipal Center driveways because the traffic signal was installed in 2012 and the Big Y store opened in August 2012. Therefore, adequate crash data do not exist for the intersection.
For MassDOT Highway Division District 3 (which includes the town of Franklin), the average crash rate for signalized intersections is 0.89 crashes per million entering vehicles (MEV).10 Analyses indicate that the average crash rates exceed the District 3 average crash rate for a signalized intersection for the following intersections:
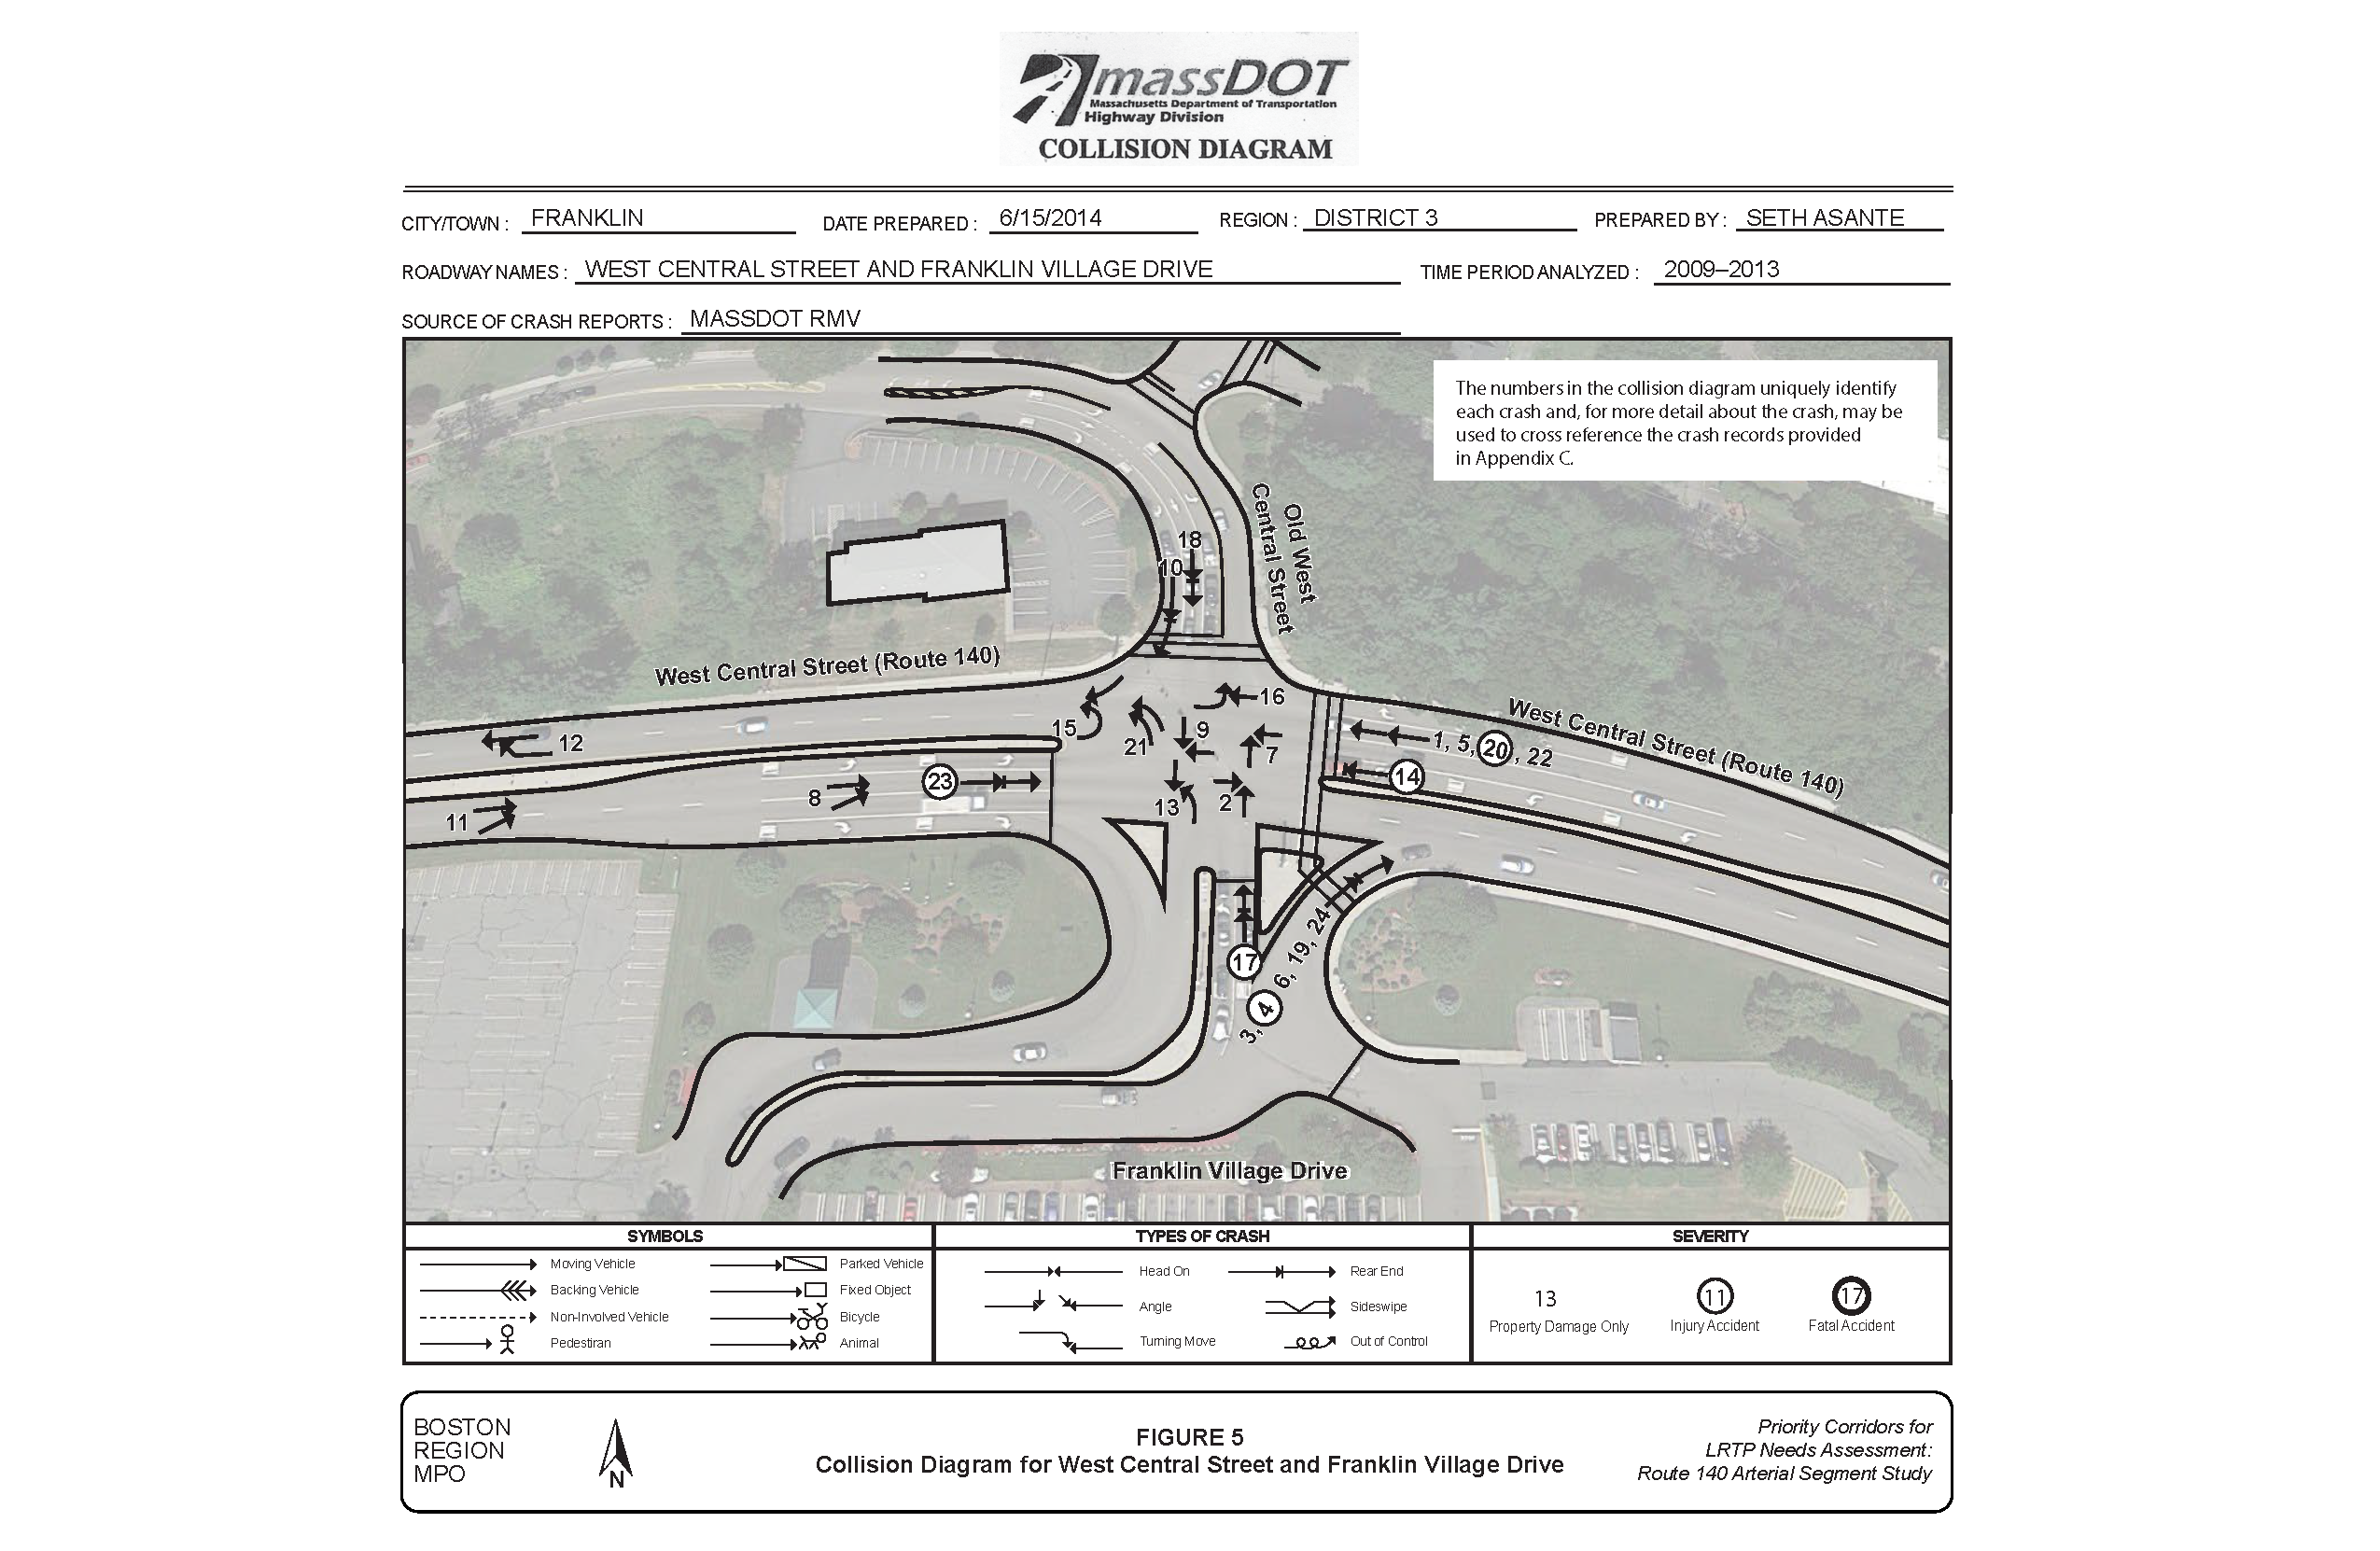
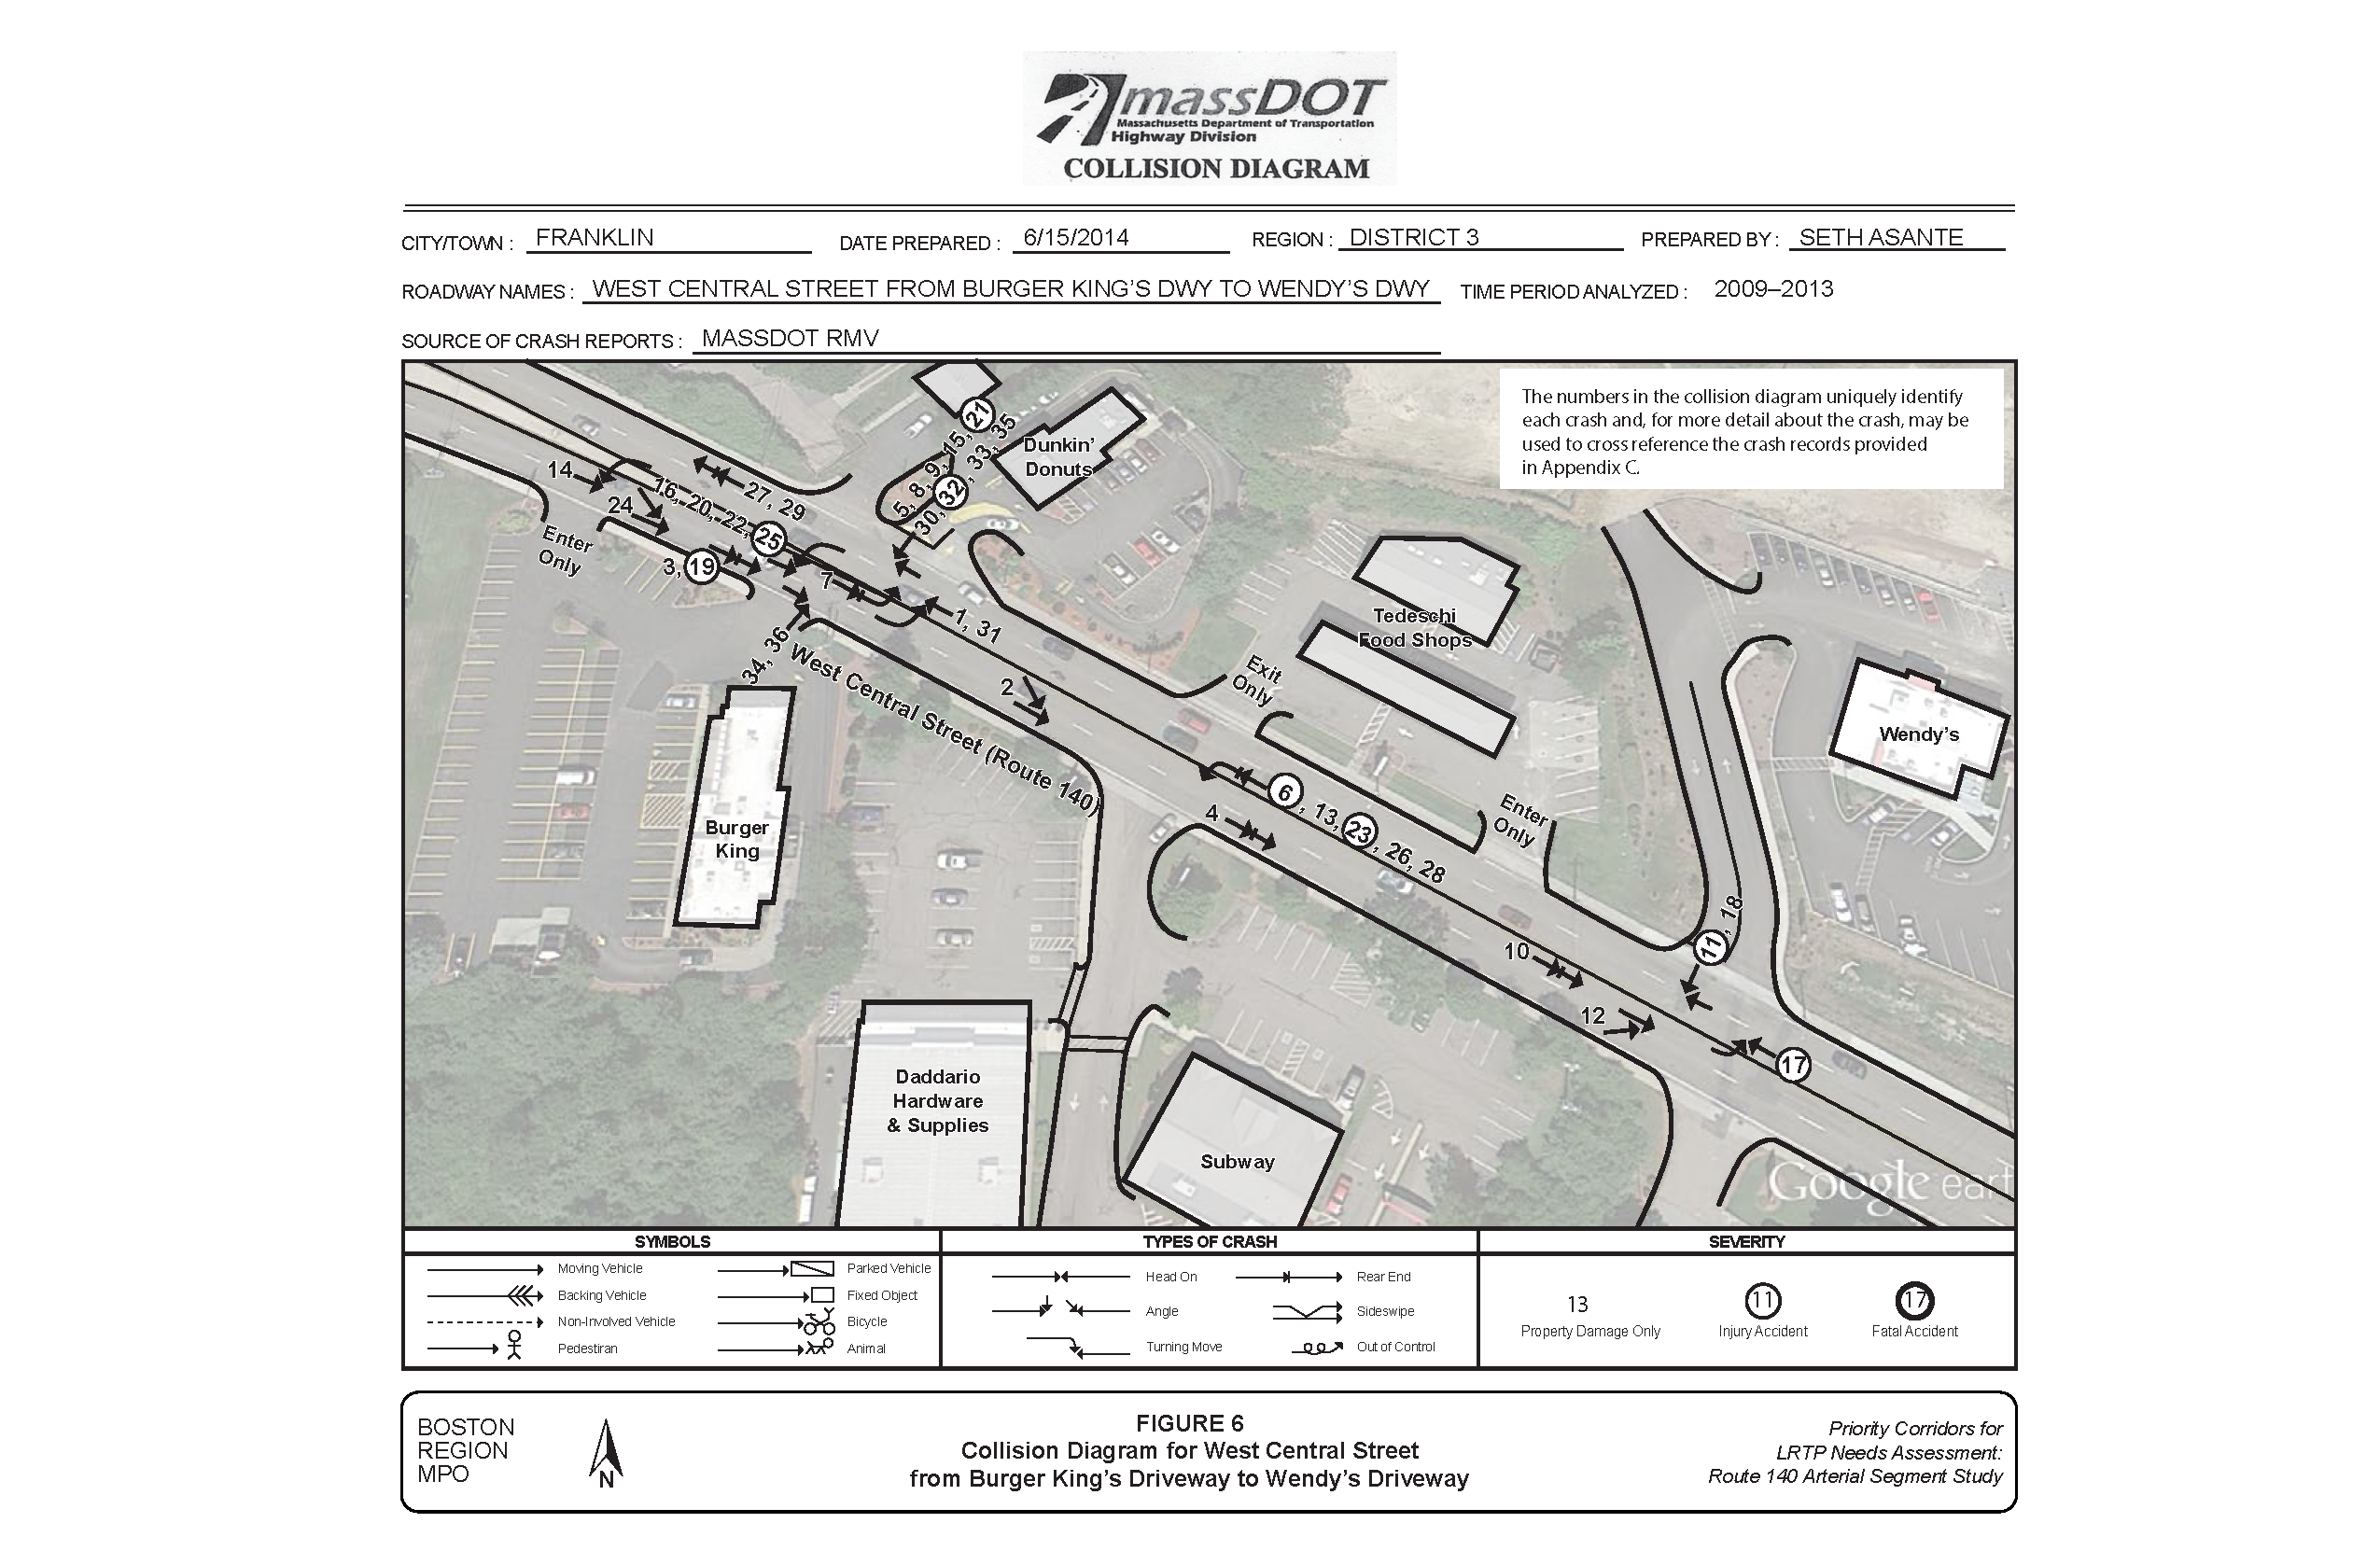
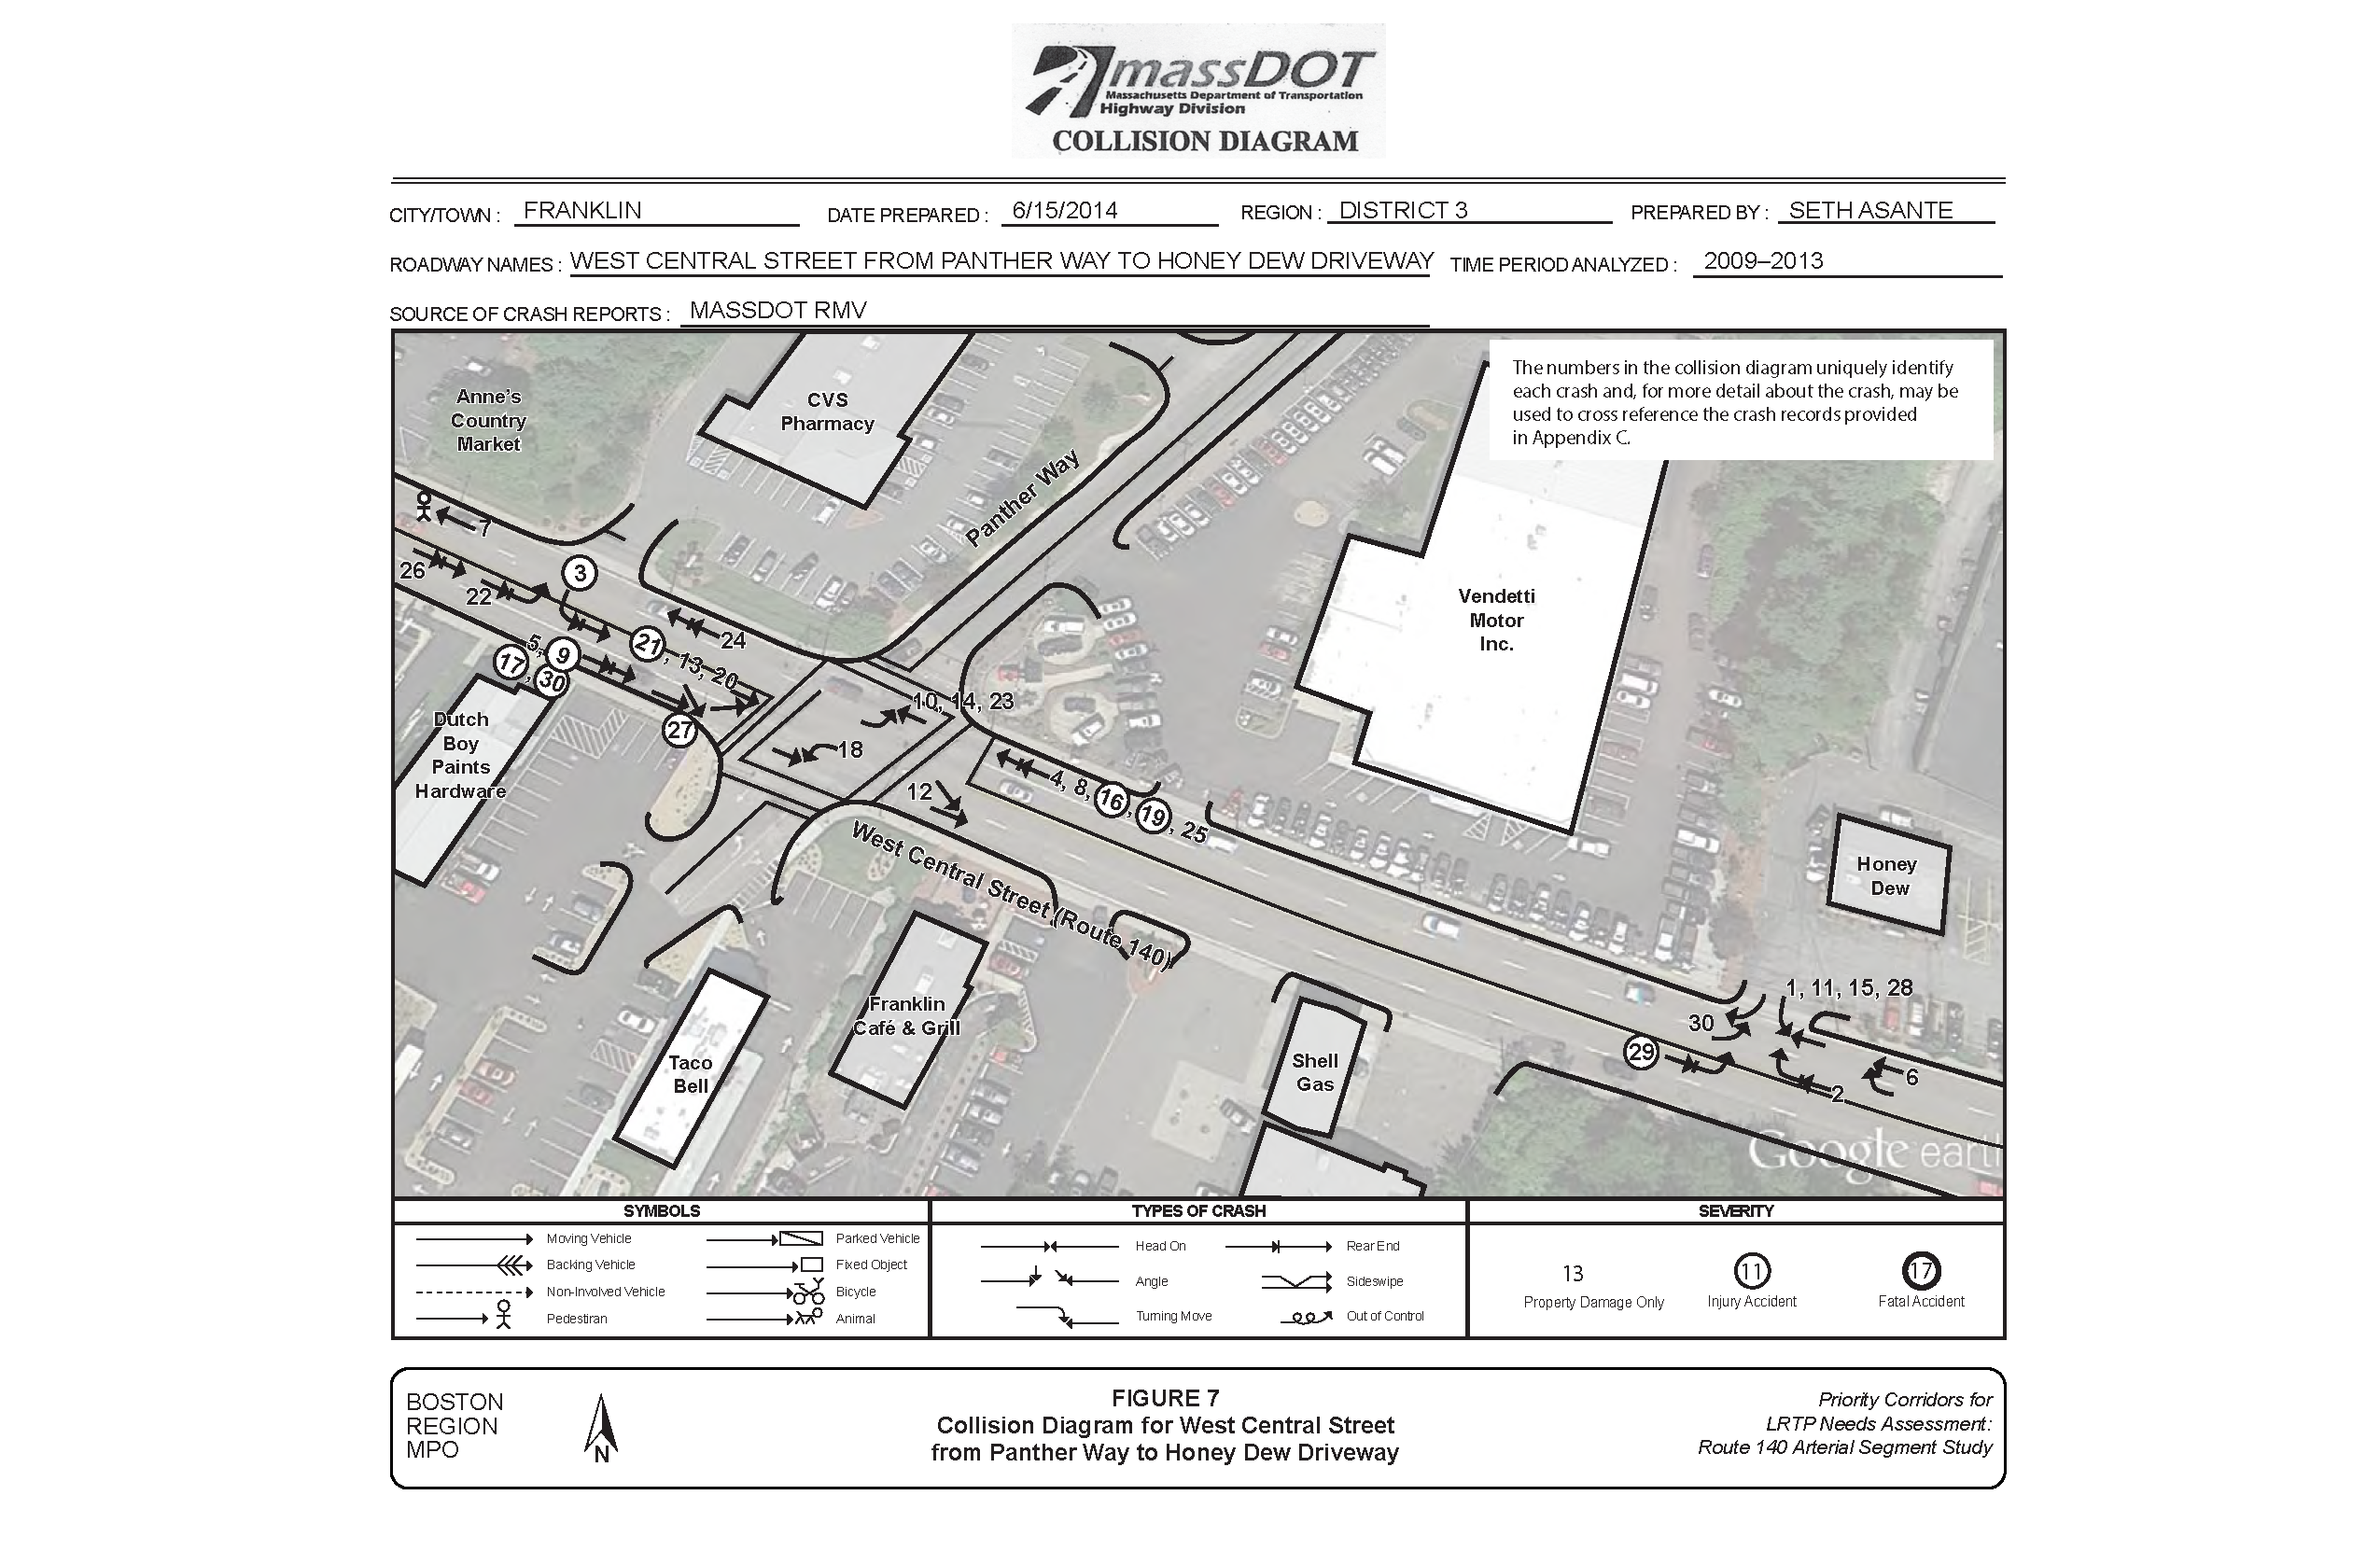
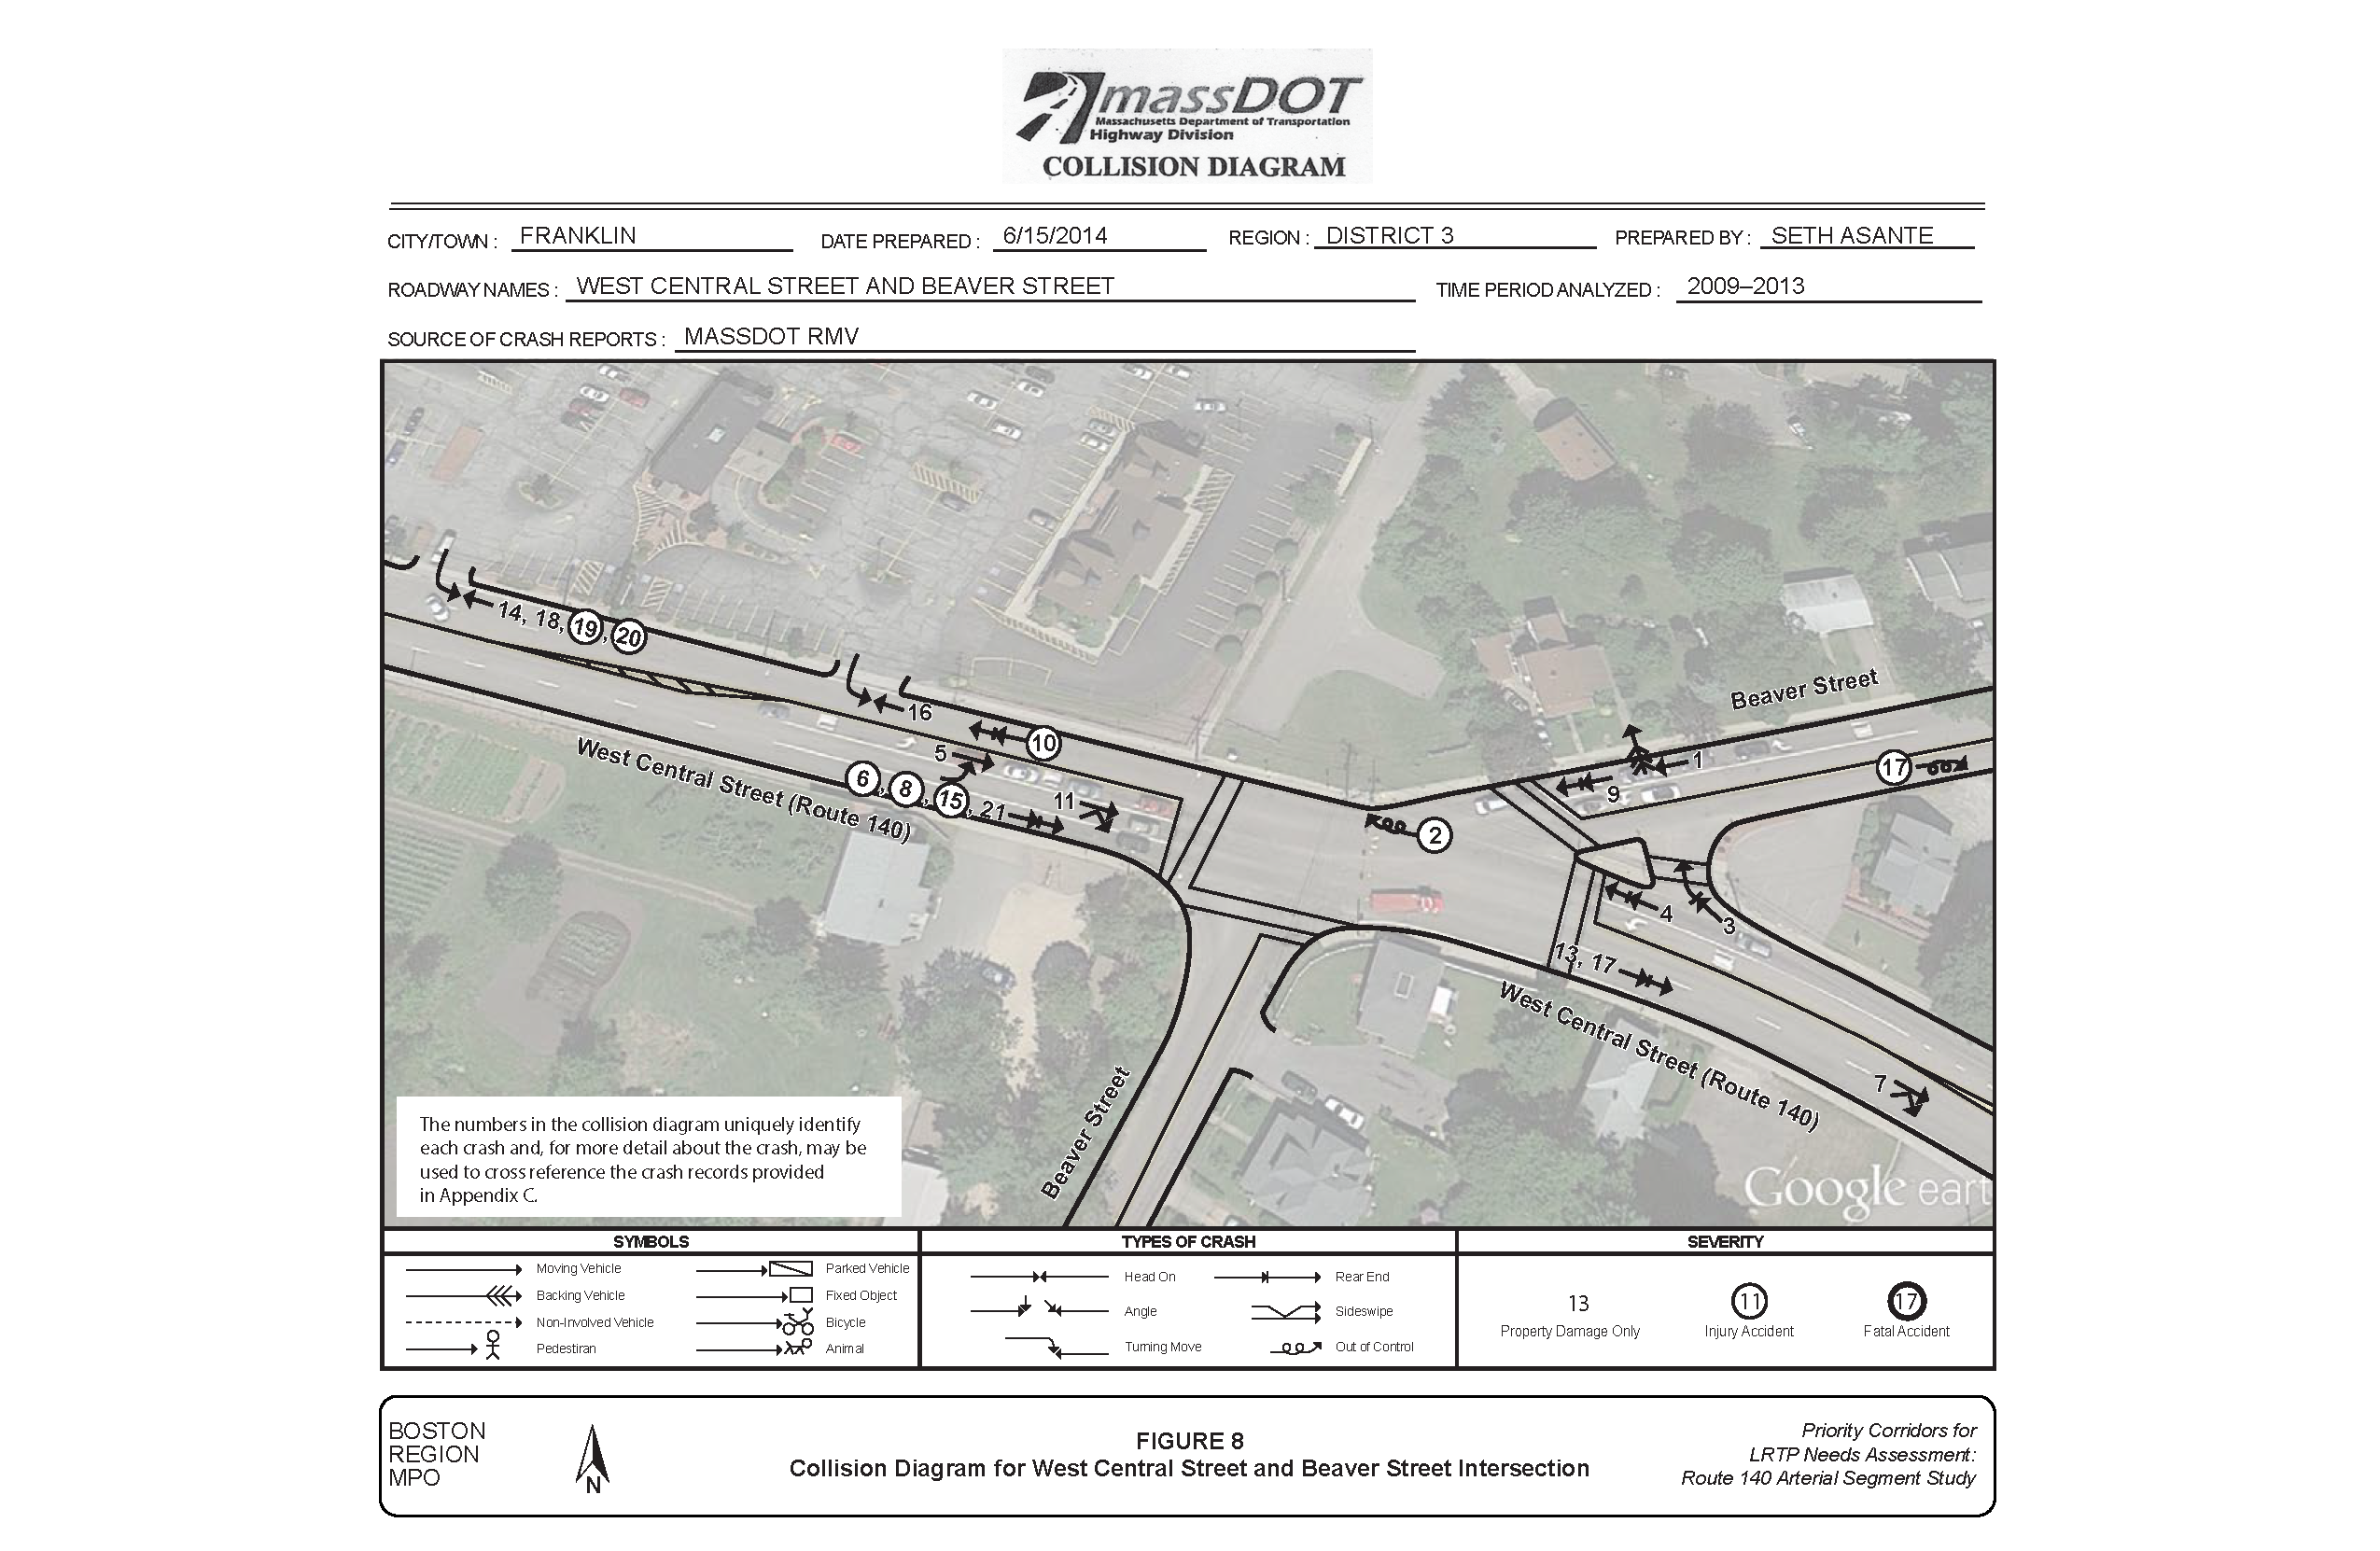
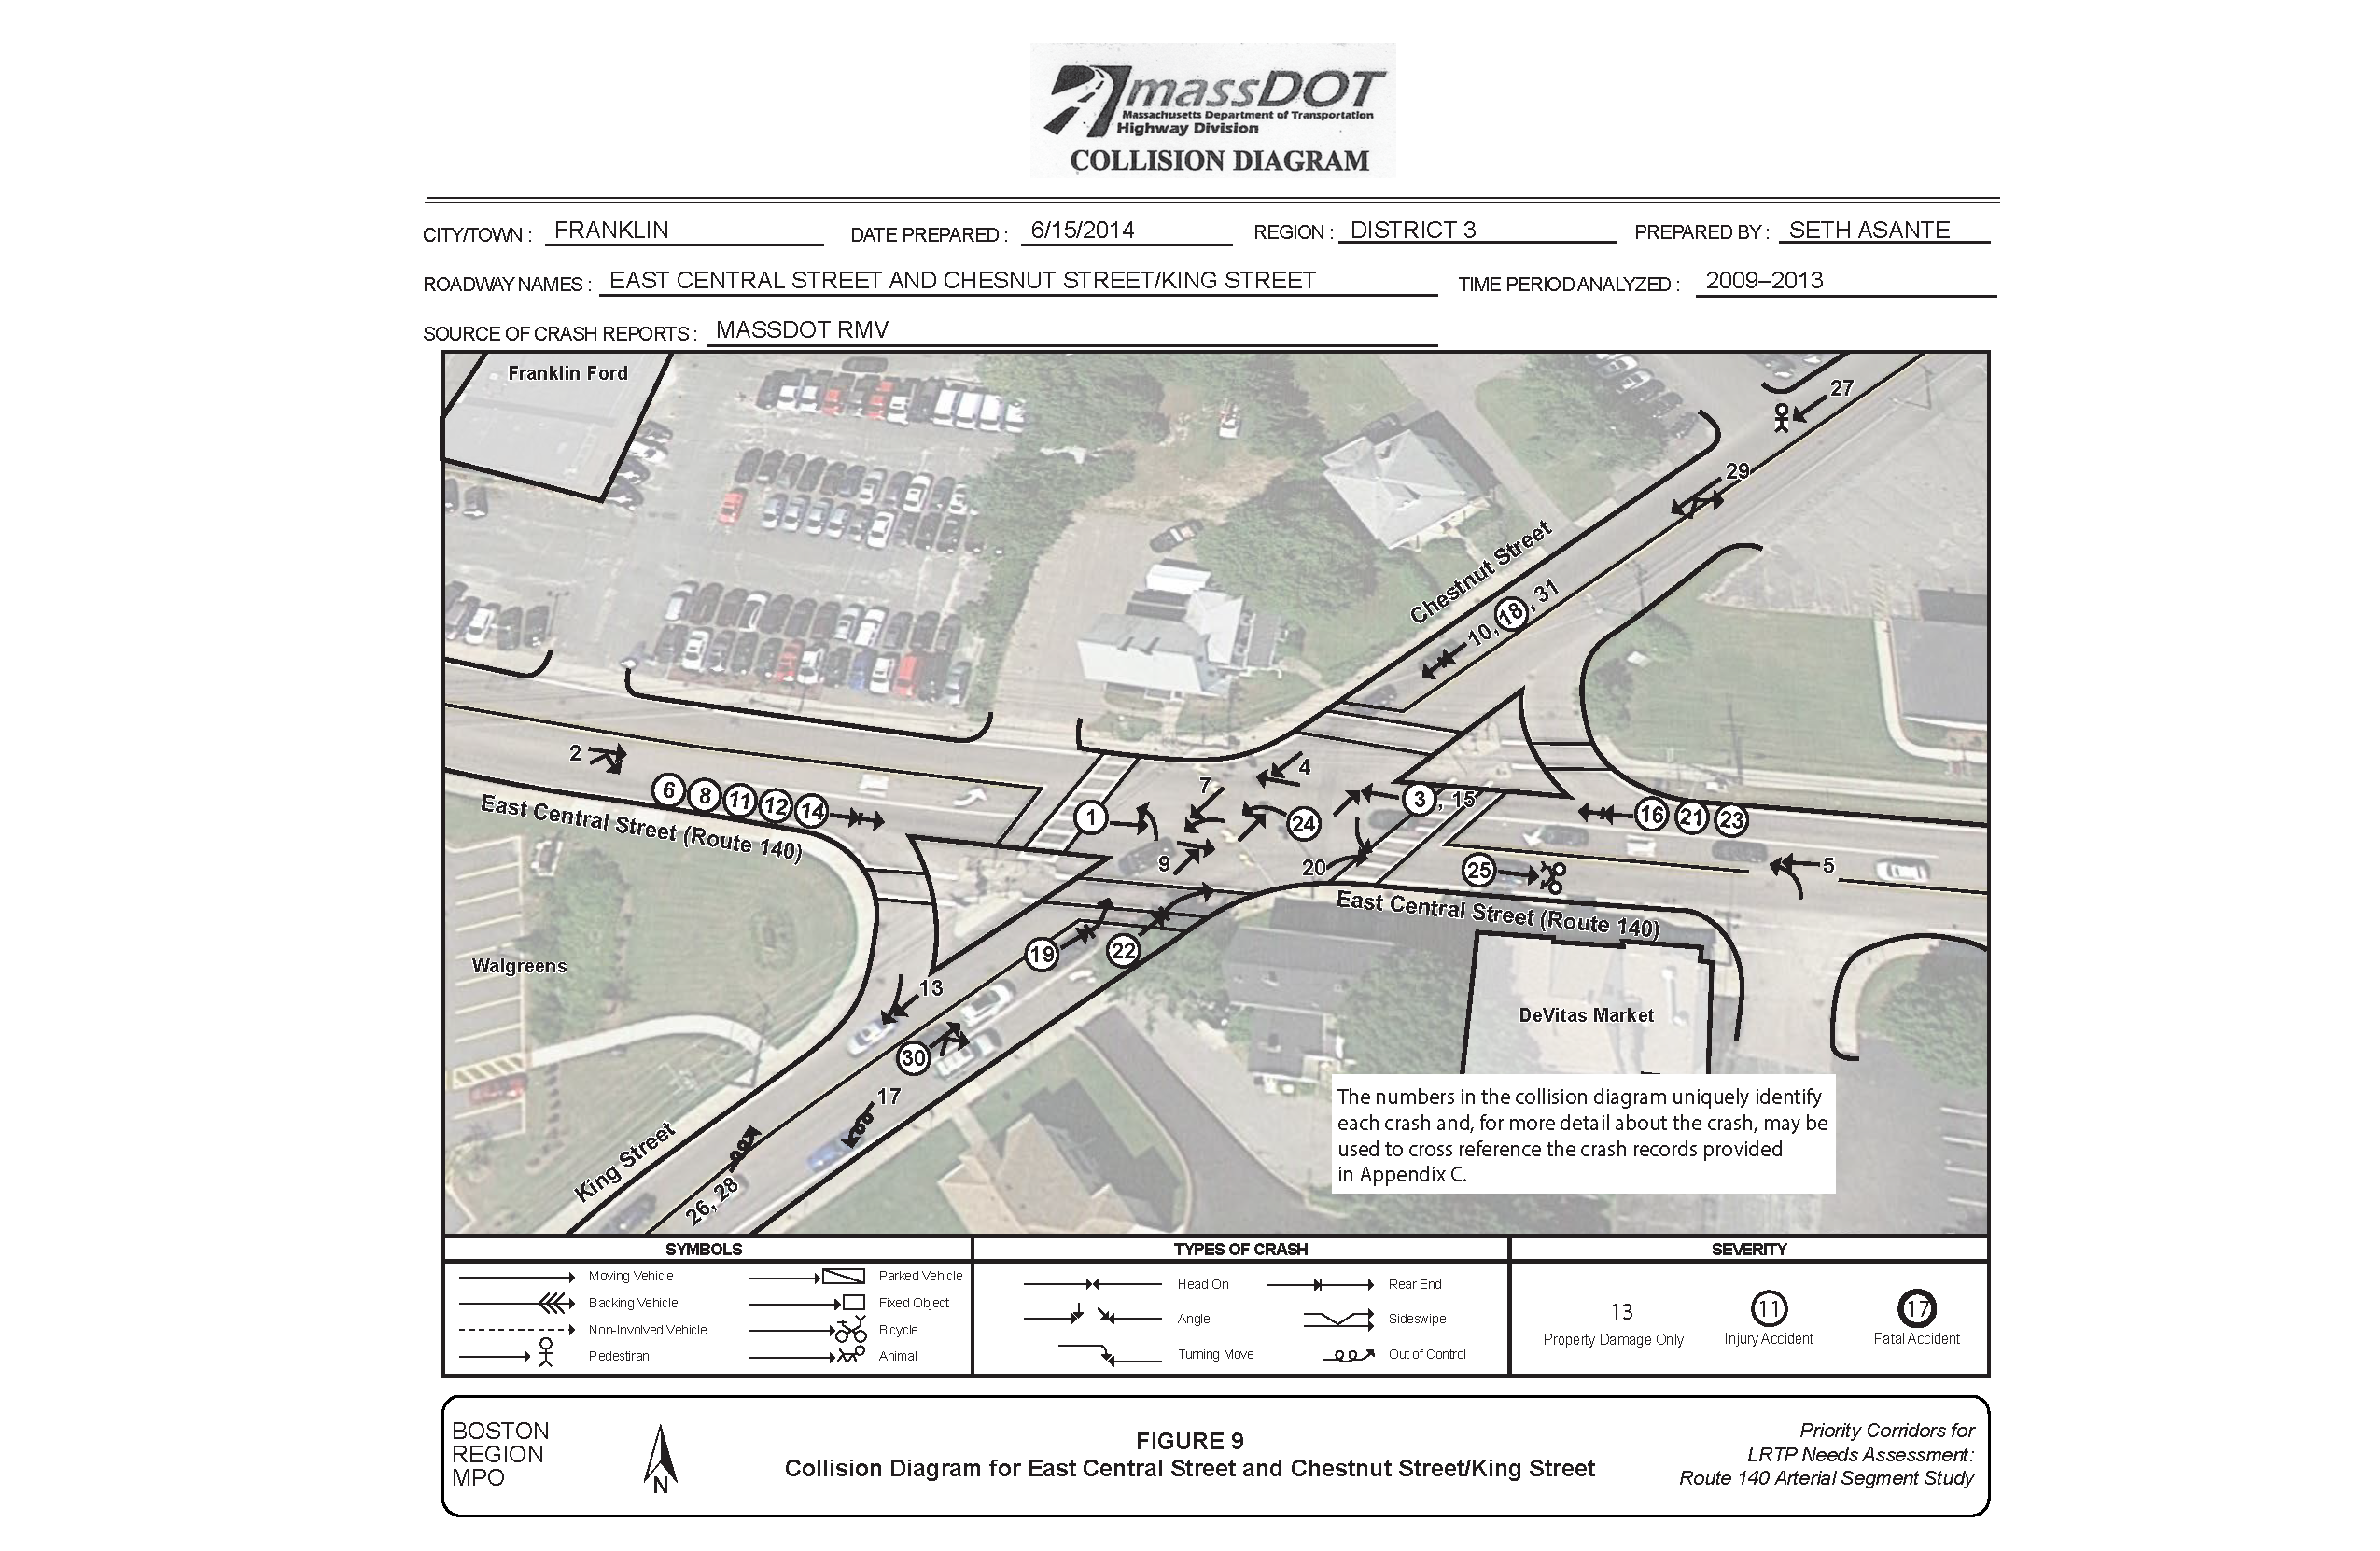
MPO staff used police crash reports to prepare collision diagrams, which are useful for examining patterns and developing safety strategies (see Figures 5 through 9).12 The collision diagram numbers uniquely identify each crash and may be used to cross reference the crash records provided in Appendix C. Figures 5 through 9 show the locations with the highest concentration of crashes as follows:
TABLE 4
Crash Summary: Study Intersections
Crash Variable |
West Central Street and Franklin Village Drive |
West Central Street and Panther Way |
West Central Street and Beaver Street |
East Central Street and King Street/ Chestnut Street |
East Central Street and Horace Mann Plaza |
|---|---|---|---|---|---|
Severity |
-- |
-- |
-- |
-- |
-- |
Fatal |
0 |
0 |
0 |
1 |
0 |
Non-fatal injury |
11 |
4 |
6 |
12 |
3 |
Property damage only |
45 |
9 |
11 |
16 |
6 |
Not Reported/unknown |
3 |
2 |
0 |
1 |
0 |
Manner of Collision |
-- |
-- |
-- |
-- |
-- |
Angle |
24 |
2 |
2 |
11 |
3 |
Rear-end |
27 |
7 |
9 |
10 |
5 |
Sideswipe, same direction |
4 |
2 |
2 |
0 |
0 |
Single vehicle crash |
3 |
2 |
2 |
1 |
0 |
Head-on |
0 |
0 |
0 |
0 |
1 |
Not reported/unknown |
1 |
2 |
2 |
1 |
0 |
Road Surface Condition |
-- |
-- |
-- |
-- |
-- |
Dry |
39 |
11 |
14 |
20 |
5 |
Wet |
11 |
3 |
1 |
4 |
1 |
Sand, mud, dirt, oil, gravel |
1 |
0 |
0 |
0 |
0 |
Not Reported/unknown |
8 |
1 |
2 |
6 |
3 |
Ambient Light Conditions |
-- |
-- |
-- |
-- |
-- |
Daylight |
47 |
13 |
14 |
18 |
7 |
Dark - lighted roadway |
9 |
2 |
1 |
8 |
2 |
Dark-not lighted roadway |
0 |
0 |
1 |
1 |
0 |
Dark-unknown roadway lighting |
0 |
0 |
0 |
1 |
0 |
Dusk |
1 |
0 |
0 |
1 |
0 |
Not Reported/unknown |
2 |
0 |
1 |
1 |
0 |
Weather Condition |
-- |
-- |
-- |
-- |
-- |
Clear |
40 |
11 |
13 |
19 |
6 |
Cloudy |
6 |
3 |
2 |
2 |
2 |
Rain |
10 |
0 |
0 |
6 |
1 |
Snow |
1 |
1 |
1 |
2 |
0 |
Not Reported/unknown |
3 |
0 |
1 |
1 |
0 |
Period* |
-- |
-- |
-- |
-- |
-- |
Peak |
19 |
8 |
5 |
7 |
2 |
Off-peak |
40 |
7 |
12 |
23 |
7 |
Total Crashes |
59 |
15 |
17 |
30 |
9 |
Four year average (rounded) |
15 |
4 |
4 |
8 |
2 |
Intersection crash rate |
1.03 |
0.45 |
0.63 |
0.91 |
0.32 |
MassDOT District 3 average crash rate |
0.89 |
0.89 |
0.89 |
0.89 |
0.89 |
* The AM peak period is 7:00 AM to 9:00 AM, and the PM peak period is 4:00 PM to 6:00 PM.
Source: Central Transportation Planning Staff.
Staff conducted traffic operations analyses consistent with the Highway Capacity Manual (HCM) methodologies (included in Appendix D)13. HCM methodology demonstrates driving conditions at signalized and unsignalized intersections in terms of LOS ratings from A through F. LOS A represents the best operating conditions (little to no delay), while LOS F represents the worst operating conditions (long delay). LOS E represents operating conditions at capacity (limit of acceptable delay). Table 5 presents the control delays associated with each LOS for unsignalized and signalized intersections.
TABLE 5
Intersection Levels of Service Criteria
Level of Service |
Signalized Intersections Control Delay |
Unsignalized Intersections Control Delay |
|---|---|---|
A |
0-10 |
0-10 |
B |
> 10-20 |
> 10-15 |
C |
> 20-35 |
> 15-25 |
D |
> 35-55 |
> 25-35 |
E |
> 55-80 |
> 35-50 |
F |
> 80 |
> 50 |
Source: Highway Capacity Manual 2010.
The town of Franklin and MassDOT Highway Division District 3 provided existing signal timings, as-built traffic signal plans, and phase sequences of the signalized intersections (included in Appendix D). Using the data collected, MPO staff built traffic analysis networks for the AM and PM peak hours with Synchro14 traffic simulation software to assess the capacity and quality of traffic flow through the signalized intersections. Tables D-1 through D-2 in Appendix D show the existing LOS in terms of delay and queues. In both arterial segments, the severe delays and queues occur in the PM peak period and on Saturday midday peak period because of the high volume of work and shopping trips. The critical movements operating at LOS F are:
Based on existing conditions’ analyses, field reconnaissance, and task force discussions, the following problems were identified.
Planners typically use a planning model to systematically forecast future traffic volume based on changes in the transportation network or land use. For this study, staff used the Boston Region MPO’s regional travel demand model set recently adopted for the Long-Range Transportation Plan (LRTP). This model’s socioeconomic components are derived from Metropolitan Area Planning Council (MAPC) forecasts. The model is calibrated at a regional level for 164 cities and towns, which includes the 101 cities and towns in the MPO region. For site-specific development and transportation projects, the model requires calibration to replicate local travel patterns in the project area before it may be used to forecast future impacts. Using this model, staff projected that traffic on West Central Street and East Central Street would grow 0.3 percent per year, resulting in three percent total growth between 2014 and 2024. The existing peak-hour turning-movement volumes were increased by three percent to 2024 future turning-movement volumes, which were used to test the alternatives.
MPO staff worked with the task force to develop short- and long-term strategies to address safety, operations, and access-management problems, which were identified in both segments. The short-term strategies are low-cost improvements that can be implemented within one to three years. The long-term improvements are more complicated, and require funding resources and design and engineering efforts.
For this segment, the strategy was to evaluate different roadway cross-sections to improve safety, operations, and access management. Potential alternatives that would widen the roadway between Dunkin Donuts and Beaver Street were not evaluated in this study because they were not recommended by the task force. MPO staff developed three alternatives for consideration based on discussions with the task force. In addition, MPO staff proposed several enhancements for the intersections to improve safety and operations. All of the improvements are mostly within the existing roadway’s right-of-way and take into account the needs of abutters and users.
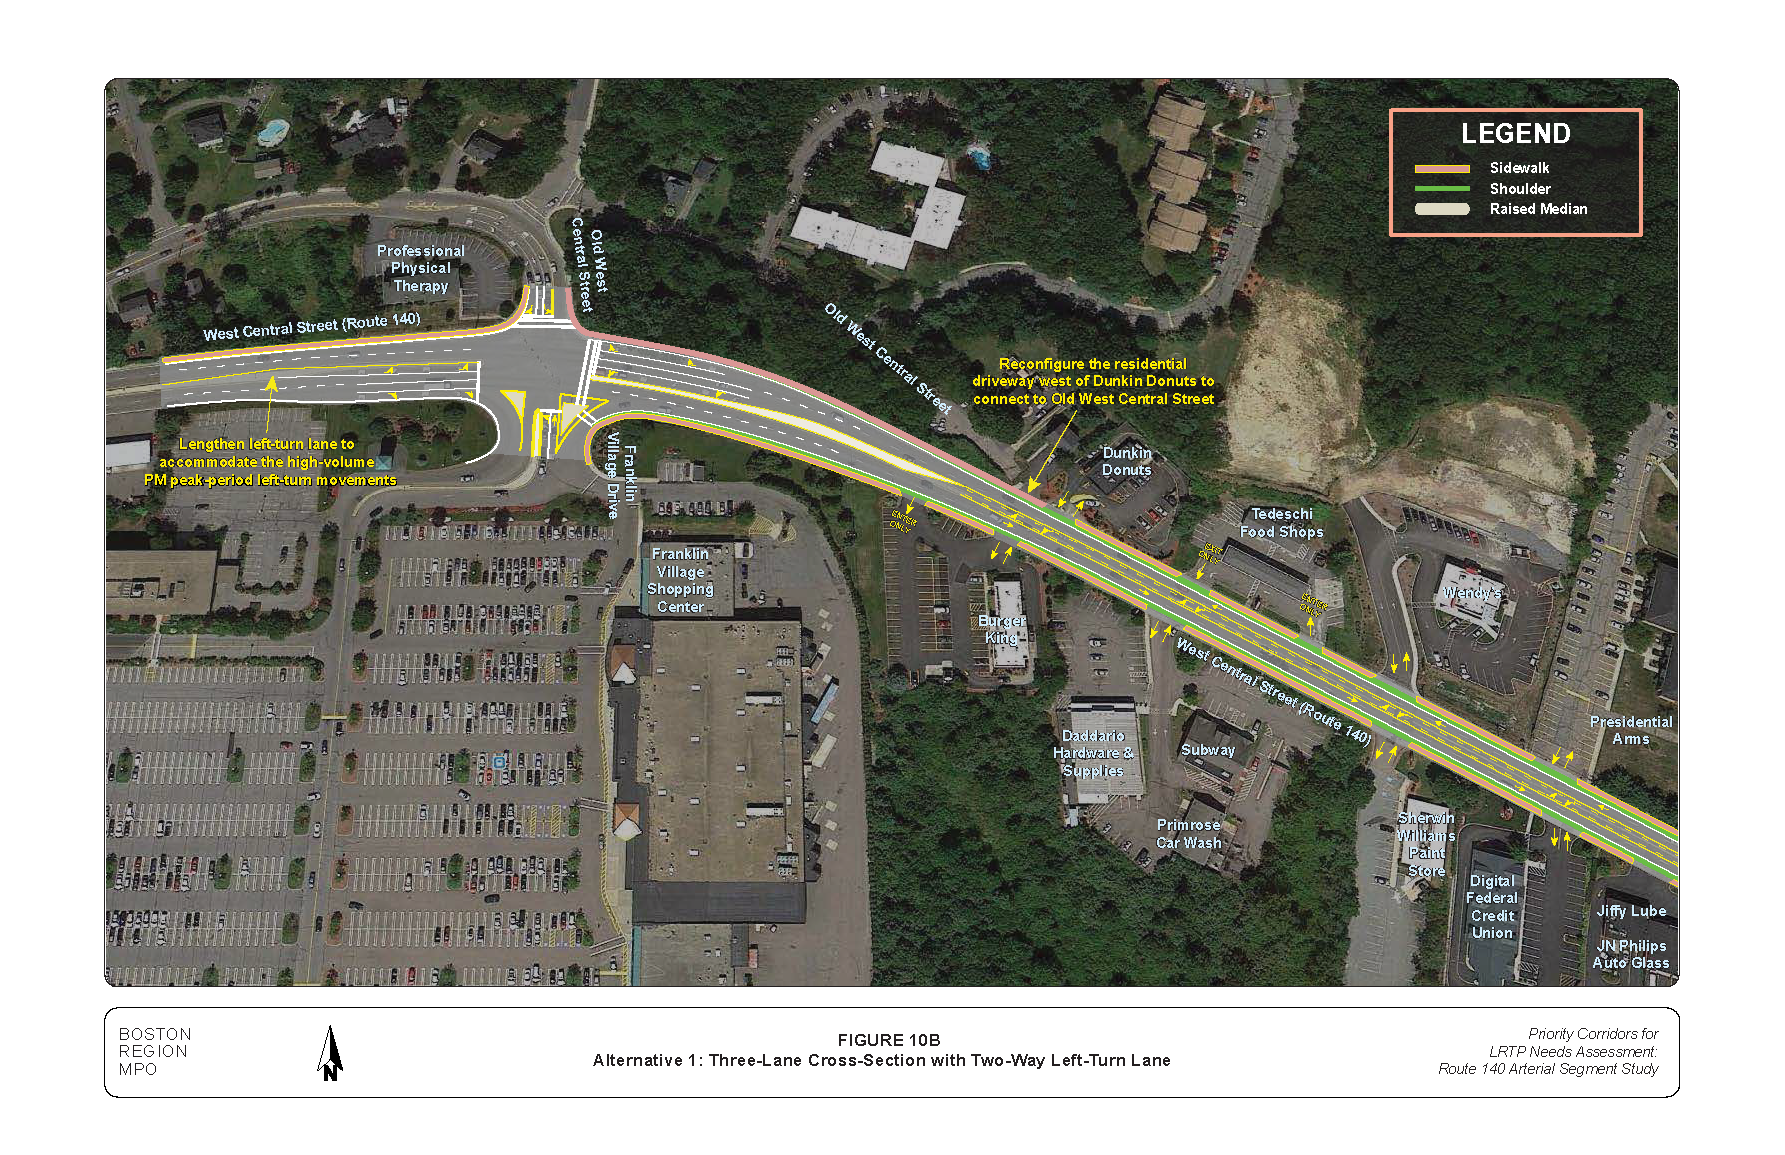
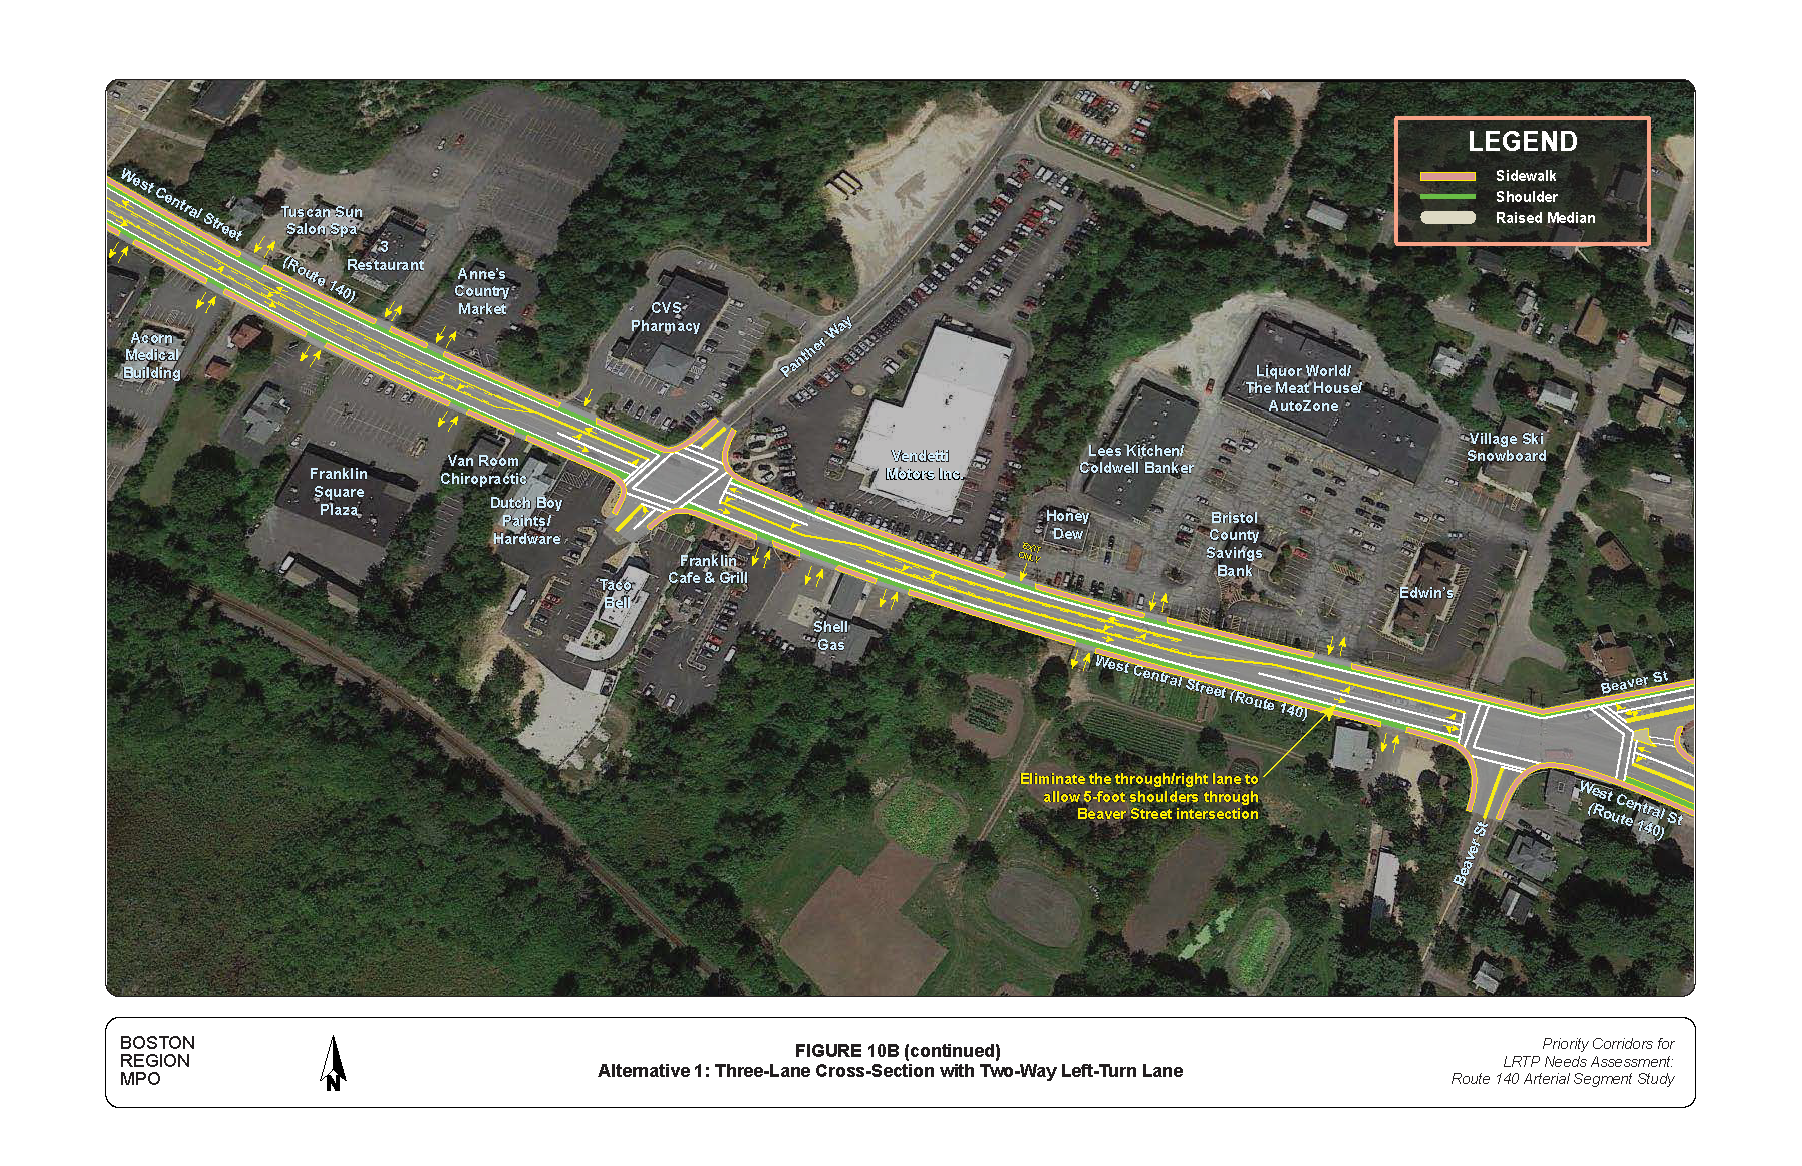
Alternative 1 is a three-lane cross-section with a two-way left-turn lane (TWLTL) and five-to-six-foot-wide shoulders as shown in Figures 10A and 10B. The effectiveness of converting a four-lane cross-section to a three-lane cross-section depends on a number of factors including: traffic flow patterns, spacing of major intersections, adjacent land uses, and future traffic growth. Tables D-3 through D-6 show the results of the intersection LOS analysis for Alternative 1 in terms of delay and queues (included in Appendix D). Arterial performance measures of Alternative 1 in terms of arterial total delay, number of stops, and average speeds are presented in Table D-7.
Using protected/permissive signal phasing for the left-turn movements, analysis indicates that Alternative 1 would operate at LOS D or better at the Panther Way intersection, and the 50th percentile traffic queue length is acceptable. The Synchro analyses show large differences between the 50th percentile and 95th percentile queue lengths on West Central Street at the Panther Way intersection. For example, during the PM peak period the westbound approach has a 50th percentile queue length of only 239 feet and a 95th percentile queue length of 1057 feet. More analysis may be necessary on this issue.
Benefits of Alternative 1 are as follows:
Disadvantages of Alternative 1 area are as follows:
Providing TWLTL where it currently does not occur would reduce left-turn related crashes by approximately 37-to-54 percent.15,16 Also, estimates of the safety benefits of adding a six-foot right shoulder suggest seven-to-eleven percent reduction in run-off-road crashes. Alternative 1 can be a cost-effective safety measure for the roadway segment given the high frequency of rear-end crashes involving a lead vehicle desiring to make a left-turn, and angle crashes involving vehicles turning left across two travel lanes. It also will help accommodate bicyclists through the corridor.
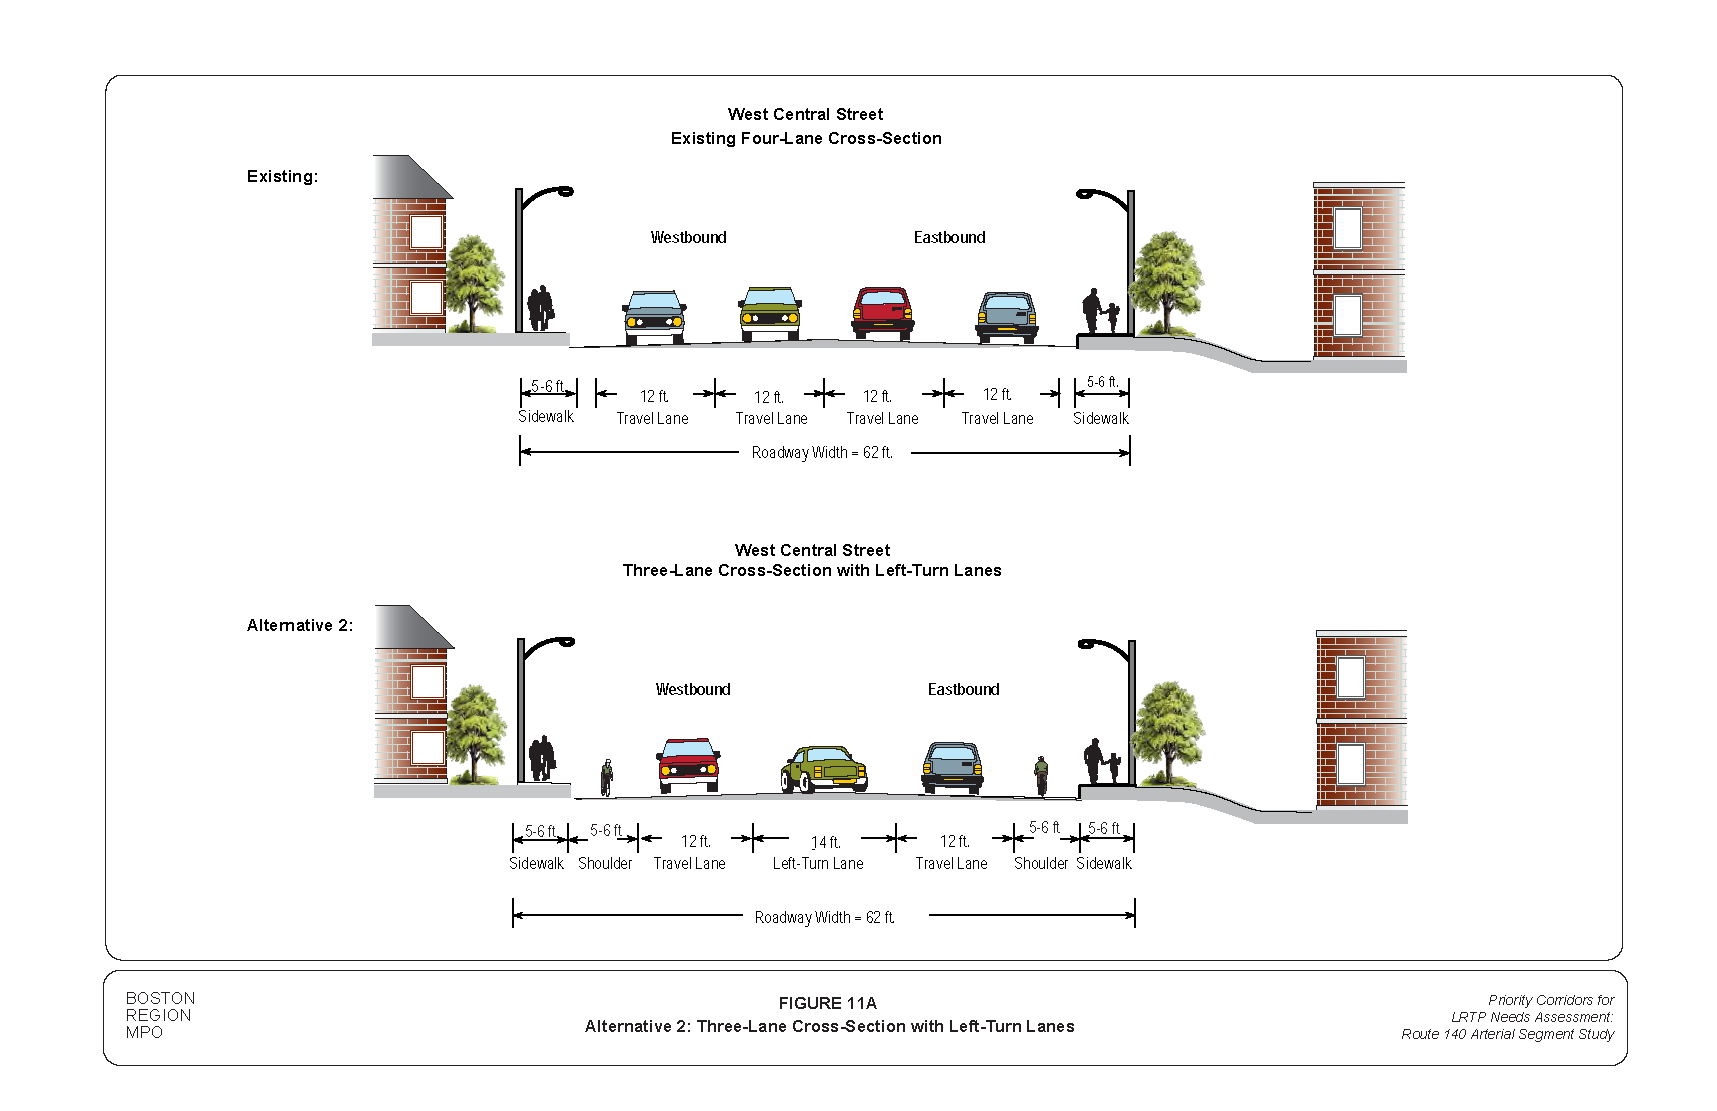
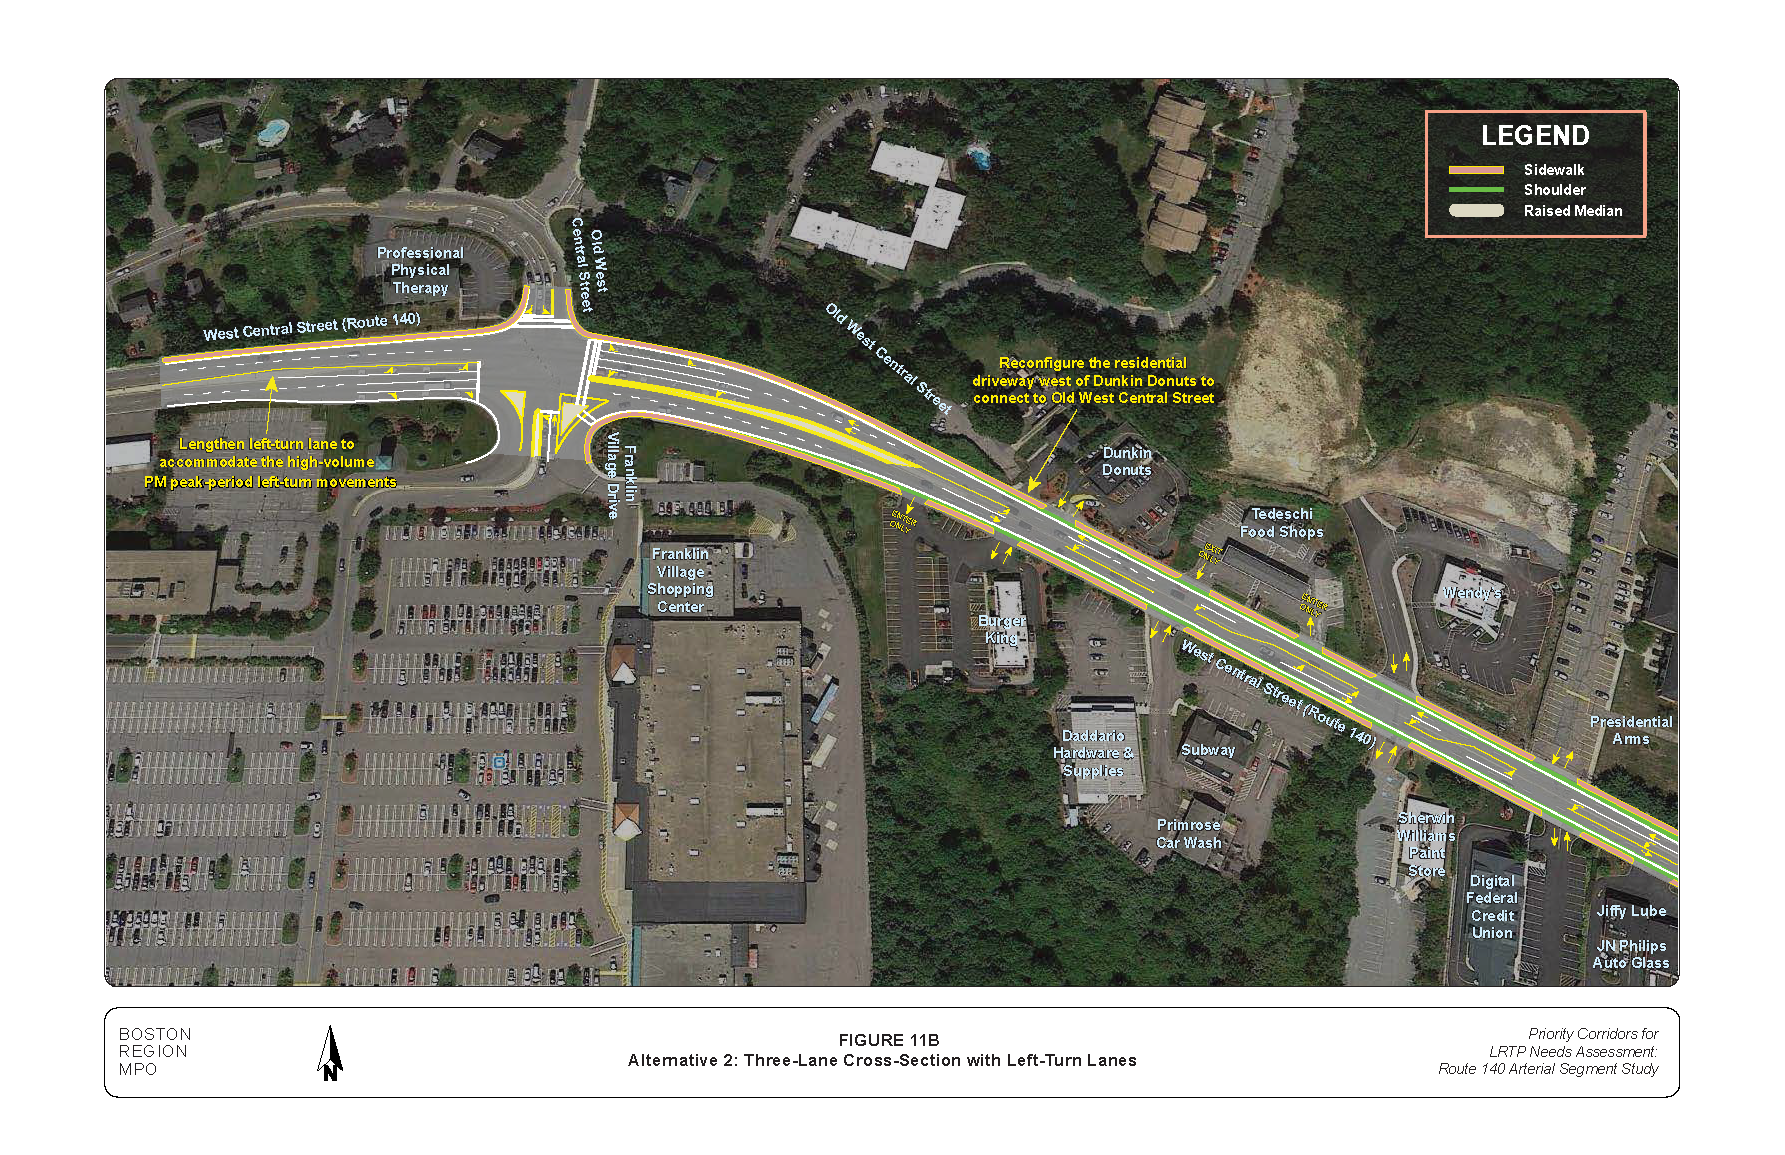
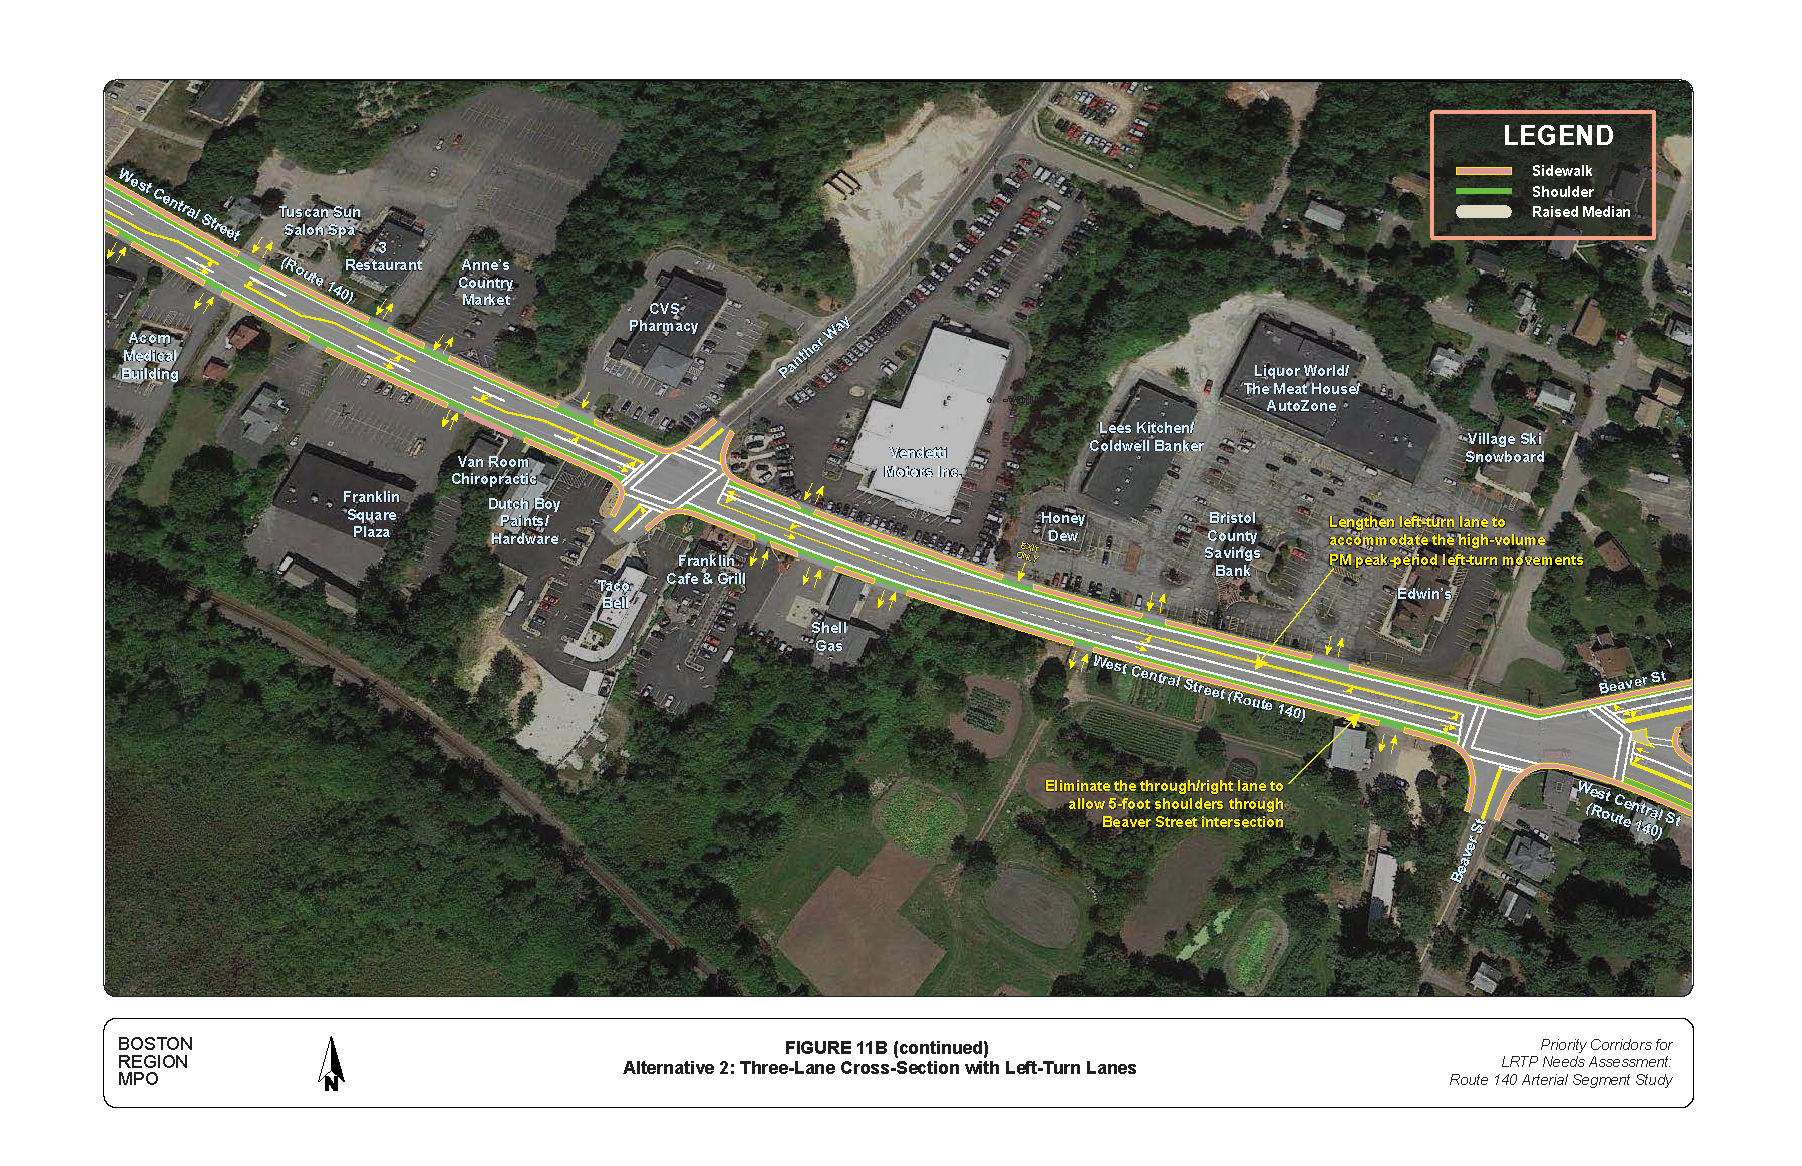
Alternative 2 is a three-lane cross-section with left-turn lanes at selected locations and five-to-six-foot-wide shoulders as shown in Figures 11A and 11B. Tables D-3 through D-6 show results of the intersection LOS analysis for Alternative 2 in terms of delays and queues (included in Appendix D). The arterial performance measures of Alternative 2 in terms of arterial travel time, stops, and speeds are presented in Table D-7. Alternative 2 produces similar intersection and arterial LOS as in Alternative 1.
Alternative 2 has many of the benefits and disadvantages of Alternative 1. The primary benefit distinguishing the alternatives is that Alternative 2 reduces the potential of head-on conflicts. The primary disadvantage distinguishing Alternative 2 from Alternative 1 is that with Alternative 2 (left-turn lanes), some business driveways will not benefit from having a safe place to wait while pulling out into traffic on West Central Street. The left turns out of driveways are not improved as much as possible with the TWLTL.
Similar to Alternative 1, adding left-turn lanes can be a cost-effective safety measure for four-lane roadway segments with a high frequency of rear-end and angle crashes involving left-turn movements. A major synthesis of research on left-turn lanes demonstrated that exclusive turn lanes on the average reduce about 50 percent of left-turn related crashes.17,18
Alternative 3: Four-Lane Cross-Section with the Option of Either Left-Turn Lanes or a TWLTL
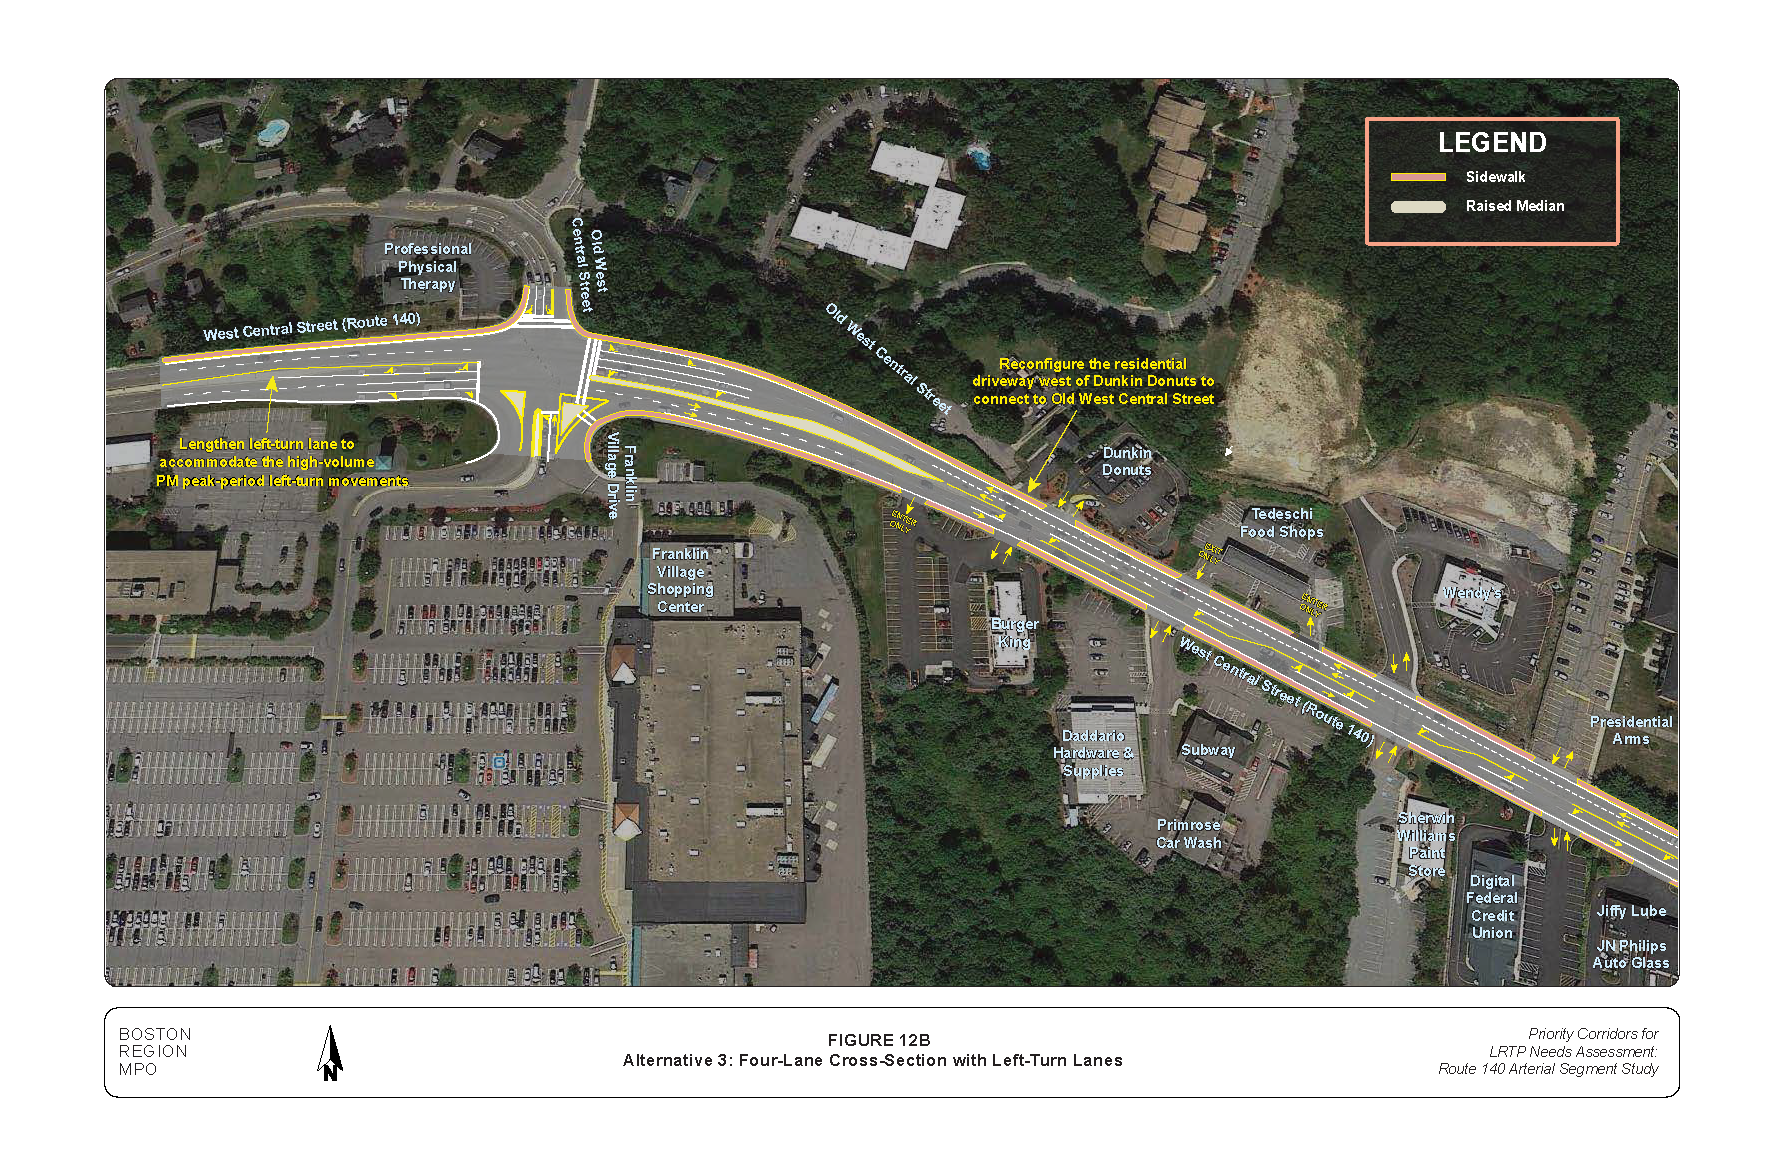
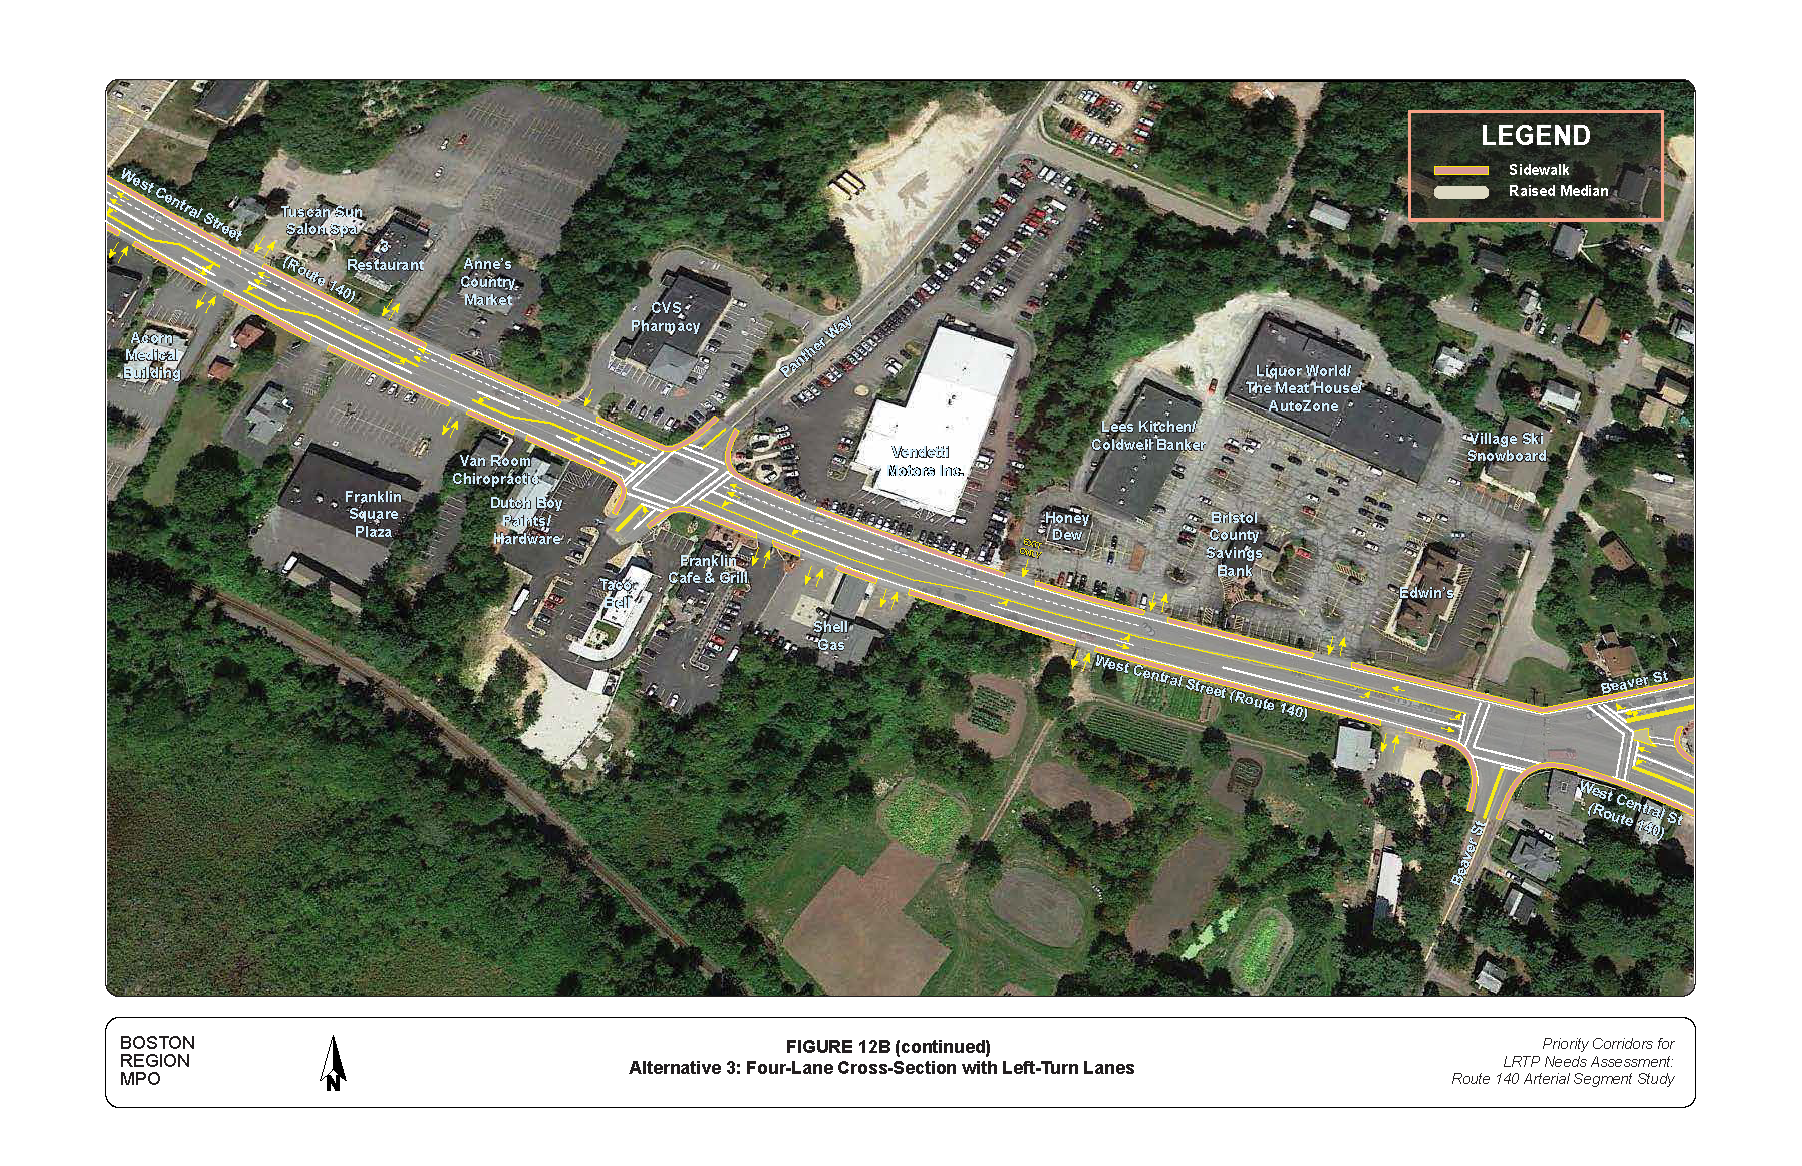
Alternative 3 is a four-lane cross-section with the option of left-turn lanes at selected locations or a TWLTL (Figures 12A and 12B). This alternative has one eastbound through travel lane and two westbound through travel lanes. Alternative 3 has no shoulders because of right-of-way constraints. Staff analyzed Alternative 3 because of likely operational traffic problems (traffic queues) at the Panther Way intersection with the three-lane cross-section concepts identified in Alternative 1 and Alternative 2.
Tables D-3 through D-6 show the results of the intersection LOS analysis for Alternative 3 in terms of delay and queues (included in Appendix D). Table D-7 shows the arterial performance measures of Alternative 3 in terms of arterial travel time, stops, and speeds. Analysis indicates that Alternative 3 would operate at a better LOS B at the Panther Way intersection compared to Alternative 1 and Alternative 2. Similar to Alternative 1, more analysis may be necessary to evaluate the duration and impacts of queues, especially at the eastbound approach at Panther Way intersection.
Benefits of Alternative 3 are as follows:
Disadvantages of Alternative 3 are as follows:
MassDOT and the town of Franklin operate segment traffic signals. Since the traffic signals are not coordinated, congestion and queues exist in this segment during peak travel periods. The strategy was to develop new timing plans to coordinate the three traffic signals to improve safety and operations. Traffic signal coordination occurs when a group of two or more traffic signals work together, so that vehicles moving along the arterial segment make the least number of stops possible. Signal retiming and coordination are cost-effective and short-term improvements.
Staff input traffic volume, signal timing, and intersection geometric and lane assignment data into a Synchro 8 model to analyze the delays, queues, and LOS at signalized intersections. Three scenarios were analyzed: existing conditions, 2014 retimed conditions, and 2024 future conditions. Each scenario also was evaluated at four time-of-day periods: AM peak, midday, PM peak, and Saturday midday periods. Horace Mann Shopping Plaza, Big Y store, Franklin Municipal Center, and businesses on East Central Street attract significant amounts of traffic during the midday and PM peak periods.
A range of cycle lengths were tested, and the cycle length that provided the most efficient progression along the segment in terms of the number of stops, delay, and average speed was selected. Table 6 shows the cycle lengths for each scenario. The final component of the retiming and coordination analyses is time-of-day settings. These settings determine the optimal timing plan for each hour of a typical weekday or weekend. Four time-of-day settings were identified by evaluating count data (hourly traffic volumes) from the segment. They are:
TABLE 6
East Central Street Segment—Summary of Cycle Lengths
Scenario |
Chestnut Street/ King Street Intersection |
Horace Mann Plaza Intersection |
Big Y/Municipal Driveways Intersection |
|---|---|---|---|
AM Peak Hour |
-- |
-- |
-- |
2014 Existing |
98 |
97 |
100 |
2014 Existing (retimed) |
90 |
90 |
90 |
2024 Future (retimed) |
95 |
95 |
95 |
Midday Peak Hour |
-- |
-- |
-- |
2014 Existing |
98 |
97 |
100 |
2024 Existing (retimed) |
90 |
90 |
90 |
2024 Future (retimed) |
110 |
110 |
110 |
PM Peak Hour |
-- |
-- |
-- |
2014 Existing |
98 |
97 |
100 |
2024 Existing (retimed) |
90 |
90 |
90 |
2024 Future (retimed) |
95 |
95 |
95 |
Saturday Peak Hour |
-- |
-- |
-- |
2014 Existing |
88 |
97 |
100 |
2024 Existing (retimed) |
120 |
120 |
120 |
2024 Future (retimed) |
120 |
120 |
120 |
Source: Central Transportation Planning Staff.
Tables D-8 through D-11 show the results of the intersection LOS analyses (included in Appendix D). Table D-12 shows the results of the arterial performance measures. The results indicate that signal retiming and coordination would improve traffic flow in the segment by reducing delays and improving travel times during peak periods. By comparing the 2014 existing conditions to the 2014 retimed conditions, staff found the following improvements in travel time:
The study identified transportation needs of the West Central Street and East Central Street arterial segments, and developed short- and long-term recommendations to address those needs. The main transportation concerns in the West Central Street segment are safety, access, and mobility. In the East Central Street segment, the main transportation concerns are safety and traffic operations. MPO staff working with a task force developed three long-term alternatives for improving user safety, access to business driveways, and accommodating pedestrians and bicyclists on the West Central Street segment. In the East Central Street segment, MPO staff developed new timing plans to coordinate the traffic signals to reduce congestion. In addition, MPO staff proposed short-term improvements at the East Central Street and King Street/Chestnut Street intersection to increase safety and operations.
The primary factors for selecting the preferred cross-section for the West Central Street segment are cost and effectiveness. MPO staff recommend either Alternative 1 or Alternative 2 for improving safety and traffic operations.
In Alternative 1, most business driveways would benefit from having a safe place to wait while pulling out into traffic on West Central Street, and the left turns out of the business driveways would be improved with a TWLTL. However, Alternative 1 may increase the potential of head-on collisions.
In Alternative 2, some of the business driveways would not realize the benefit of having a safe place to wait while pulling out into traffic on West Central Street, and the left turns out of the driveways would not work as well as the TWLTL. However, Alternative 2 may reduce the potential of head-on collisions.
The study provides MassDOT and the town of Franklin with an opportunity to begin identifying the needs of West Central Street and East Central Street, and to start planning design and engineering efforts. The long-term improvements hinge on cooperation between MassDOT and the town of Franklin in selecting the preferred alternative for implementation. The next steps are to implement the preferred low-cost, short-term improvements and to complete project notification forms (PNF) for the long-term improvements.
MassDOT is responsible for implementing the short- and long-term improvements on the West Central Street segment. It is important for MassDOT to examine the design of the long-term alternatives, and participation in this process by the West Central Street business community is important.
The recommendation to retime and coordinate traffic signals on East Central Street may require new equipment to synchronize the signal controllers. In addition, it may be necessary to replace one or more of the controllers in case they cannot accommodate the suggested four time-of-day recommendations, or if they do not work with the other controllers. Because of the mixed jurisdictions of the traffic signals in the East Central Street segment, MassDOT and the town of Franklin have shared responsibility for implementing and operating a coordinated signal system. The town of Franklin is responsible for implementing the recommended improvements at the intersection of East Central Street and King Street/Chestnut Street.
Transportation decision making is complex, and is influenced by factors such as financial limitations and agency programmatic commitments. Project development is the process that takes a transportation improvement from concept to construction. Appendix E includes an overview of the project development process.
SA/sa
1 Paths to a Sustainable Region, the Long-Range Transportation Plan of the Boston Region Metropolitan Planning Organization, September 22, 2011.
2 Transportation Improvement Program and Air Quality Conformity Determination, Federal Fiscal Years 2015–18, endorsed by the Boston Region Metropolitan Planning Organization on July 10, 2014.
3 Safety Conditions: Location has a higher-than-average crash rate for its functional class, location contains a HSIP-eligible crash cluster, location contains a top-200 high crash location, or location has a significant number of pedestrian and bicycle crashes (two or more per mile).
4 Congested Conditions: Travel time index is at least 1.3
5 Multimodal Significance: Location carries bus route(s), is adjacent to a transit stop or station, supports bicycle or pedestrian activities or has an implementation project to support one or more of these activities, or has need to accommodate pedestrians and bicyclists.
6 Regional Significance: Location carries high proportion of regional traffic or noticeable commuter bicycle traffic.
7 Implementation Potential: Location is under MassDOT jurisdiction, has a Transportation Improvement Process (TIP) “conceptual” status, or has a strong commitment from a city or town.
8 Greater Attleboro Regional Transit Authority (GATRA),Franklin Area Bus, Bus Schedule Effective January 23, 2012, http://www.gatra.org/wp-content/uploads/Franklin_schedule_0112.pdf
9 Published by MassDOT based on crash information queried on August 13, 2014
10 Published by MassDOT based on crash information queried on January 23, 2013
11 "Equivalent property damage only" is a method of combining the number of crashes with the severity of crashes based on a weighted scale where a fatal crash is worth 10, an injury crash is worth 5, and a property damage only crash is worth 1.
12 Some crash reports did not have diagrams and are not included in Figures 5 to 9.
13 Highway Capacity Manual 2010, Transportation Research Board of the National Academies, Washington, DC, December 2010.
14 Trafficware Inc., Synchro Studio 8, Synchro plus SimTraffic, Build 801, Version 563, Sugar Land, Texas.
15 Crash Modification Factors Clearinghouse, U.S. Department of Transportation, Federal Highway Administration, http://www.cmfclearinghouse.org/index.cfm
16 Gates, T. J., Noyce, D. A., Talada, V., and Hill, L., "The Safety and Operational Effects of "Road Diet" Conversion in Minnesota." 2007 TRB 86th Annual Meeting: Compendium of Papers CD-ROM, Vol. TRB#07-1918, Washington, D.C., (2007)
17 Gluck, J., H. S. Levinson, and V. Stover, 1999, Impacts of Access Management Techniques, NCHRP Report 420, Transportation Research Board.
18 Crash Modification Factors Clearinghouse, U.S. Department of Transportation, Federal Highway Administration, http://www.cmfclearinghouse.org/index.cfm